
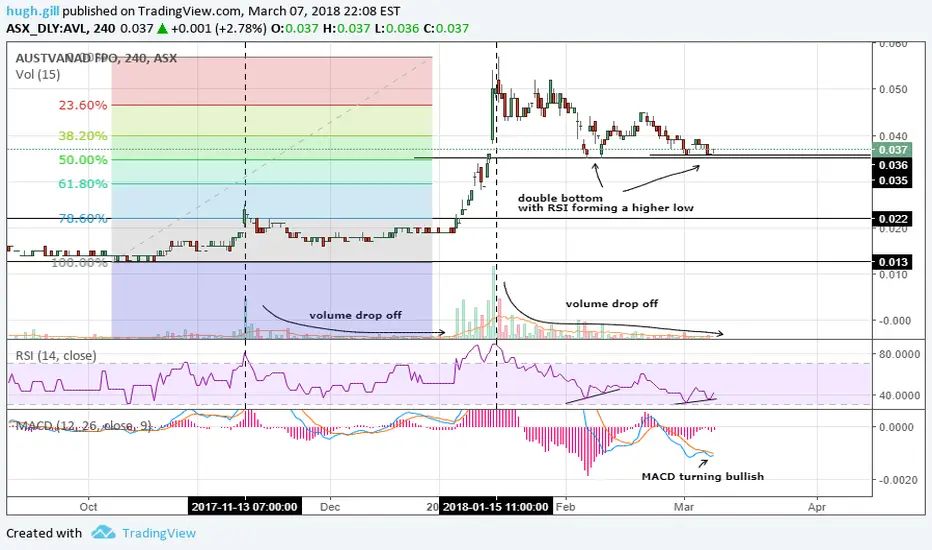
AVL has had a nice run up in price and has recently pulled back about 40% before finding support on the 50% FIB level..
Bullish Indicators:
Double Bottom on 50% Fib
Higher Low on 50% Fib
RSI creating higher low on 4 hour chart (showing strength)
Monthly RSI cooled off.
Volume has dropped off significantly. (usually see this before a big pump)
I noticed this exact set up on another chart KRC screenshot below

Entry .036 - .037
Target .065
Stoploss .034
Stoploss
Bullish Indicators:
Double Bottom on 50% Fib
Higher Low on 50% Fib
RSI creating higher low on 4 hour chart (showing strength)
Monthly RSI cooled off.
Volume has dropped off significantly. (usually see this before a big pump)
I noticed this exact set up on another chart KRC screenshot below
Entry .036 - .037
Target .065
Stoploss .034
Stoploss
交易开始
KRC Weekly RSI CooloffAVL Weekly RSI Cooloff

免责声明
这些信息和出版物并非旨在提供,也不构成TradingView提供或认可的任何形式的财务、投资、交易或其他类型的建议或推荐。请阅读使用条款了解更多信息。