
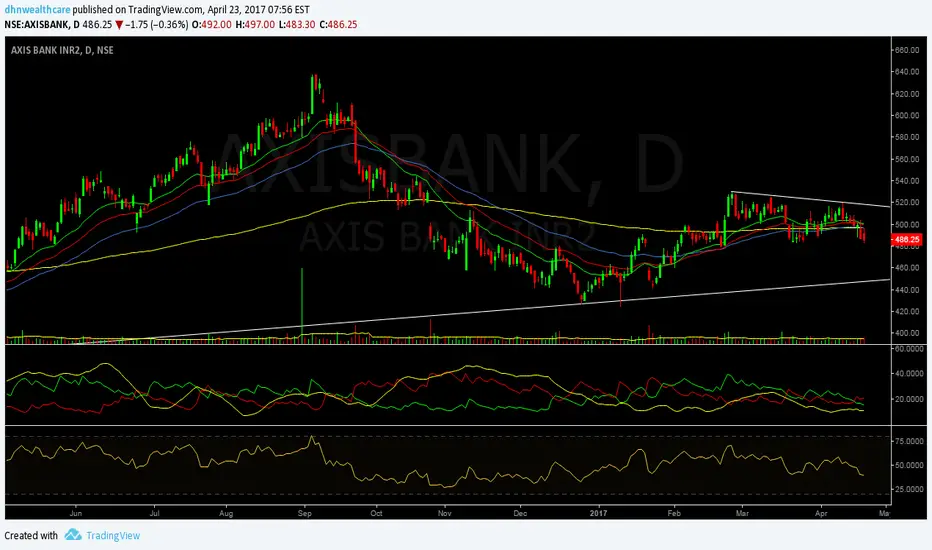
Chart of Axis Bank is suggesting weakness in stock price in coming days. Stock has closed below all short and long term moving averages. Additionally RSI and ADX has given negative divergence on both daily as well as weekly charts.
One can initiate short position on stock between 483-487 levels with stop loss of 521 (last up swing move) for target of 450 in coming 4-6 weeks.
One can initiate short position on stock between 483-487 levels with stop loss of 521 (last up swing move) for target of 450 in coming 4-6 weeks.

免责声明
这些信息和出版物并非旨在提供,也不构成TradingView提供或认可的任何形式的财务、投资、交易或其他类型的建议或推荐。请阅读使用条款了解更多信息。
免责声明
这些信息和出版物并非旨在提供,也不构成TradingView提供或认可的任何形式的财务、投资、交易或其他类型的建议或推荐。请阅读使用条款了解更多信息。