
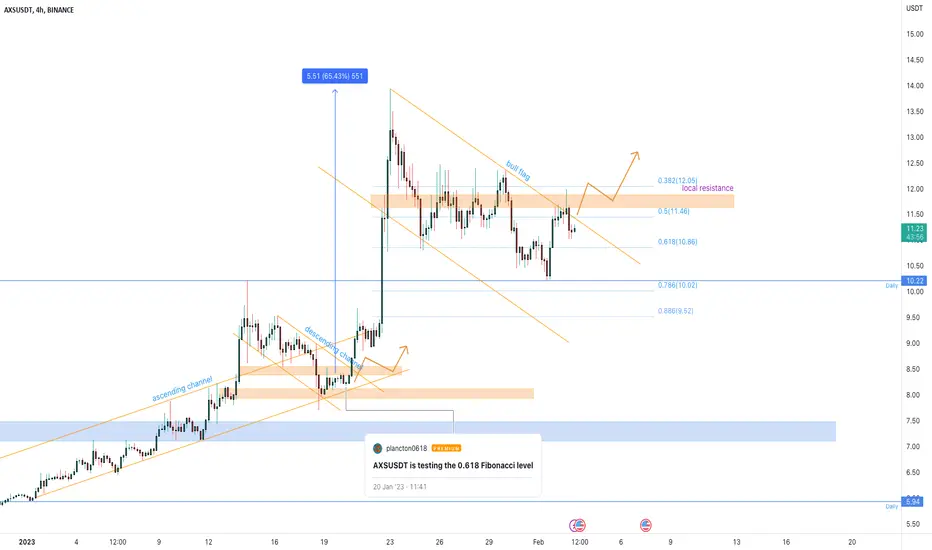
AXSUSDT is inside the bull flag
A bullflag is a chart pattern that occurs in an upward trending market and is characterized by a period of consolidation or retracement within a parallel channel, creating a flag-like shape. The pattern is considered bullish as it often precedes a continuation of the uptrend.
In this case, AXSUSDT is testing the 0.618 Fibonacci level inside a bullflag formation.
The price has increased 63% since the previous idea after a clear breakout from a descending channel. Additionally, the price created an engulfing pattern on the daily support at the 10$ area, which could be a bullish signal, so According to Plancton's strategy, we can set a nice order
–––––
Keep in mind.
–––––
Follow the Shrimp 🦐
A bullflag is a chart pattern that occurs in an upward trending market and is characterized by a period of consolidation or retracement within a parallel channel, creating a flag-like shape. The pattern is considered bullish as it often precedes a continuation of the uptrend.
In this case, AXSUSDT is testing the 0.618 Fibonacci level inside a bullflag formation.
The price has increased 63% since the previous idea after a clear breakout from a descending channel. Additionally, the price created an engulfing pattern on the daily support at the 10$ area, which could be a bullish signal, so According to Plancton's strategy, we can set a nice order
–––––
Keep in mind.
- 🟣 Purple structure -> Monthly structure.
- 🔴 Red structure -> Weekly structure.
- 🔵 Blue structure -> Daily structure.
- 🟡 Yellow structure -> 4h structure.
- ⚫️ black structure -> <= 1h structure.
–––––
Follow the Shrimp 🦐
注释
no breakout so far注释
Waiting for the breakout注释
8% 
免责声明
这些信息和出版物并非旨在提供,也不构成TradingView提供或认可的任何形式的财务、投资、交易或其他类型的建议或推荐。请阅读使用条款了解更多信息。