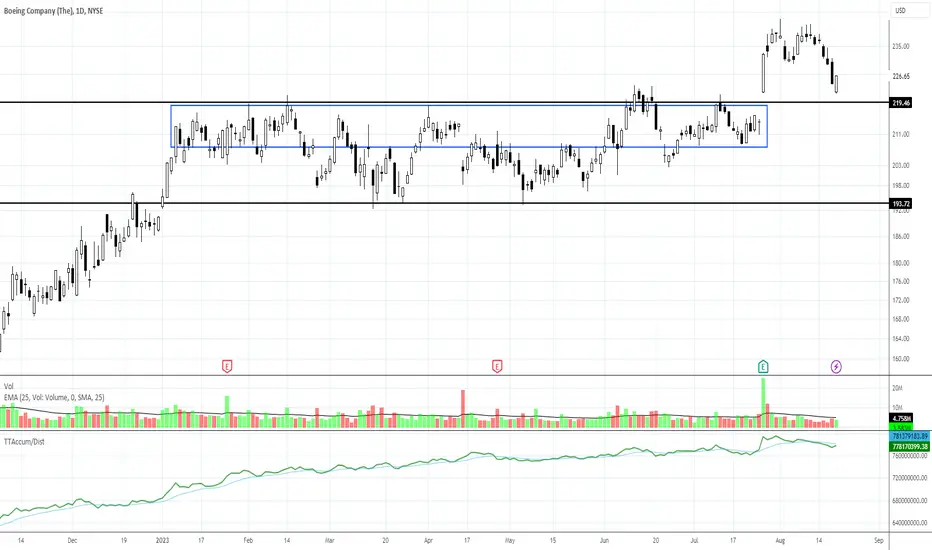
The Daily Chart of  BA shows where the probable support will halt the selling for Boeing.
The long sideways trend is close to being a platform. The highs, or within the highs of the range, should provide strong support for the stock.
If it dips deeper, it is likely to be temporary and should shift back to the higher area of the sideways trend.
BA shows where the probable support will halt the selling for Boeing. The long sideways trend is close to being a platform. The highs, or within the highs of the range, should provide strong support for the stock.
If it dips deeper, it is likely to be temporary and should shift back to the higher area of the sideways trend.

Martha Stokes, CMT
Chartered Market Technician
Co-founder, CEO & Head Instructor at TechniTrader
Learn more at the TechniTrader Learning Center: ttrader.im/learning-center
Chartered Market Technician
Co-founder, CEO & Head Instructor at TechniTrader
Learn more at the TechniTrader Learning Center: ttrader.im/learning-center
免责声明
这些信息和出版物并非旨在提供,也不构成TradingView提供或认可的任何形式的财务、投资、交易或其他类型的建议或推荐。请阅读使用条款了解更多信息。