
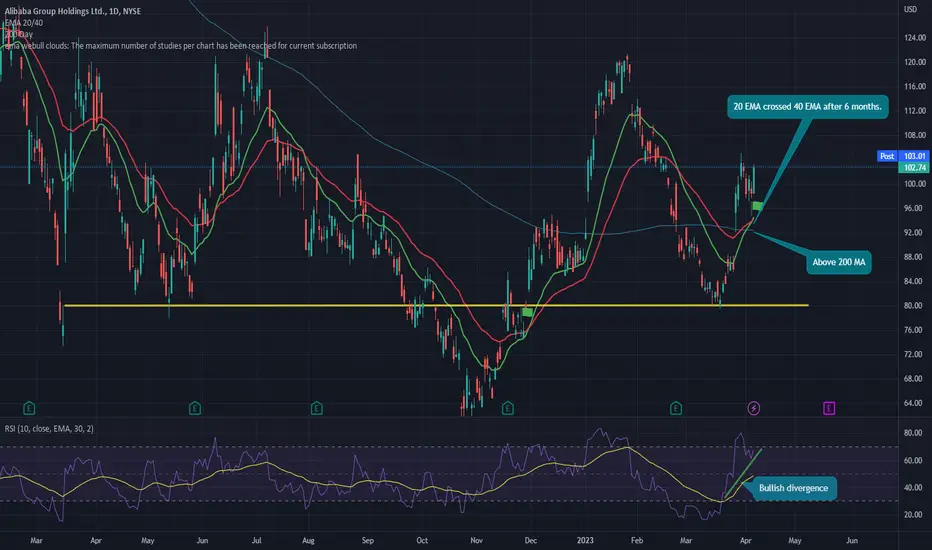
Made this chart simples as I could, so everyone could understand. Few thing happened that are extremely bullish. First, price is above 200 moving average. Second, 20 EMA crossed 40 EMA after 6 months(last time this happened Alibaba went from $66 to $120 in weeks) 3. It formed bullish divergence on RSI. I marked all the details. Pls this is not any financial advice or anything, I am just trying to make this chart as simple as I can. You are welcome to make any comments, positive and negative. Thank you

免责声明
这些信息和出版物并非旨在提供,也不构成TradingView提供或认可的任何形式的财务、投资、交易或其他类型的建议或推荐。请阅读使用条款了解更多信息。