做多
BAL/USDT Analysis
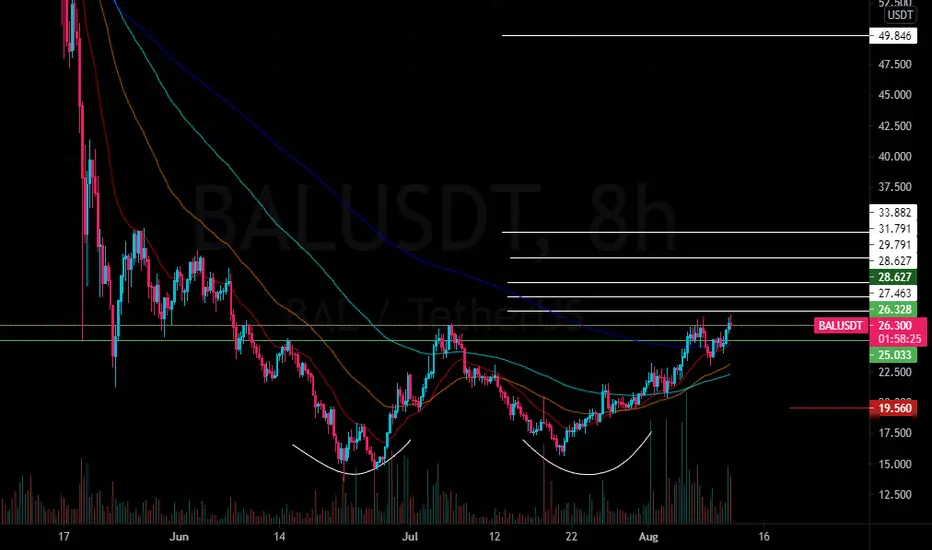
BAL/USDT forming a double bottom pattern on the 8h chart the price is above all the EMAs (20 50 100 200) shows a potential bullish move is expected.
Green= Buy Range
White= TPs
Red= SLs
Enjoy the trade, Cheers!
-Mr. Khan
Green= Buy Range
White= TPs
Red= SLs
Enjoy the trade, Cheers!
-Mr. Khan
注释
4 Targets hit交易结束:到达目标

免责声明
这些信息和出版物并非旨在提供,也不构成TradingView提供或认可的任何形式的财务、投资、交易或其他类型的建议或推荐。请阅读使用条款了解更多信息。