
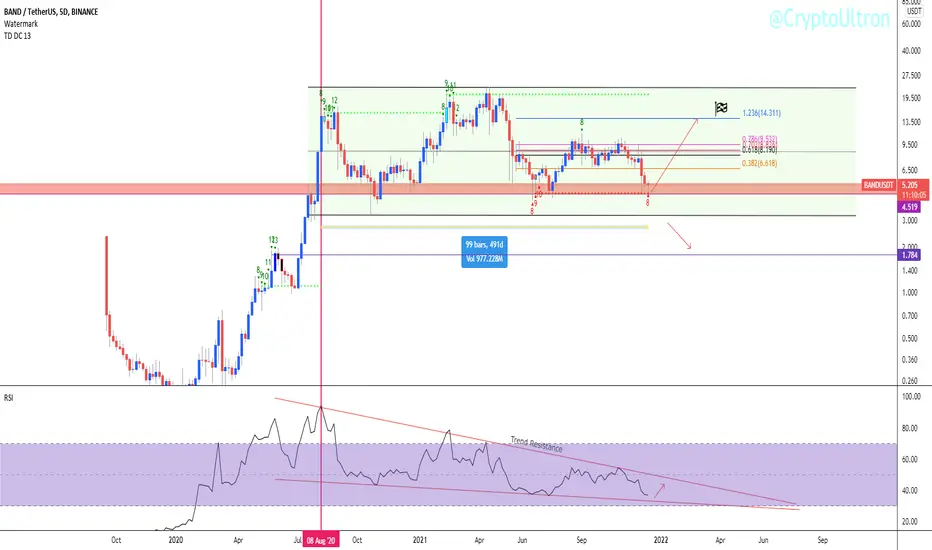
5D chart
BAND has been in the sideway channel for over 490 days in a range between 5$- 22$ while the rsi continues printing lower low. Given the fact that RSI nearly oversold and the price is currently at the bottom of the channel, I would scoop some in the red box on the chart (4.80 -5.10)
Until the RSI downtrend is broken be cautious. Once it breaks expect fireworks.
Invalidation point 4,50
Potential resistance/ target:
5.68 – 6.20 - 6.60 – 7.33
Once this level are cleared other TP on the chart are valid.
If you want maximum gain buy here and #HODL 14$+
BAND has been in the sideway channel for over 490 days in a range between 5$- 22$ while the rsi continues printing lower low. Given the fact that RSI nearly oversold and the price is currently at the bottom of the channel, I would scoop some in the red box on the chart (4.80 -5.10)
Until the RSI downtrend is broken be cautious. Once it breaks expect fireworks.
Invalidation point 4,50
Potential resistance/ target:
5.68 – 6.20 - 6.60 – 7.33
Once this level are cleared other TP on the chart are valid.
If you want maximum gain buy here and #HODL 14$+

免责声明
这些信息和出版物并非旨在提供,也不构成TradingView提供或认可的任何形式的财务、投资、交易或其他类型的建议或推荐。请阅读使用条款了解更多信息。
免责声明
这些信息和出版物并非旨在提供,也不构成TradingView提供或认可的任何形式的财务、投资、交易或其他类型的建议或推荐。请阅读使用条款了解更多信息。