
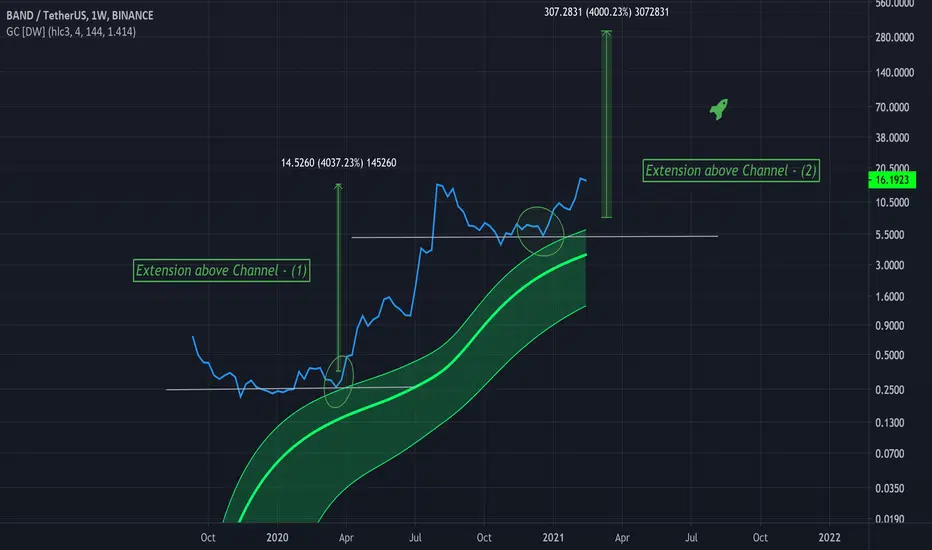
Within the green circles touches on the Gaussian channel can be seen, well, clearly on the first one, the second one is a bit above.
This is a great bounce area for price as price is in a full bull trend, as shown by the Gaussian indicator.
This is the chart for BANDUSDT, and if this second circle acts as a touch on the Gaussian indicator a strong bounce upward could occur.
And if history holds any merit, a 4000% move up could be in play.
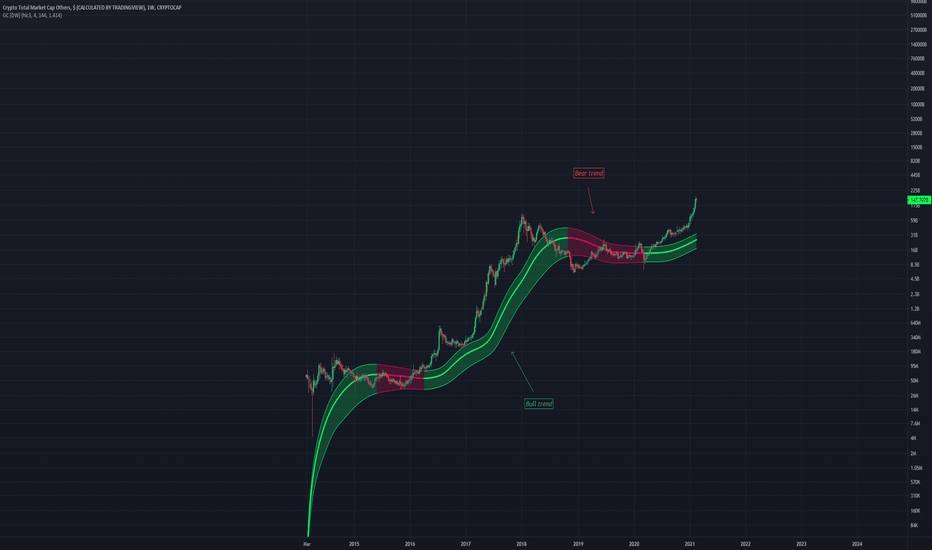
Above is a chart that has a link to this indicator in the comments.
It is very helpful.
This is a great bounce area for price as price is in a full bull trend, as shown by the Gaussian indicator.
This is the chart for BANDUSDT, and if this second circle acts as a touch on the Gaussian indicator a strong bounce upward could occur.
And if history holds any merit, a 4000% move up could be in play.
Above is a chart that has a link to this indicator in the comments.
It is very helpful.

免责声明
这些信息和出版物并非旨在提供,也不构成TradingView提供或认可的任何形式的财务、投资、交易或其他类型的建议或推荐。请阅读使用条款了解更多信息。