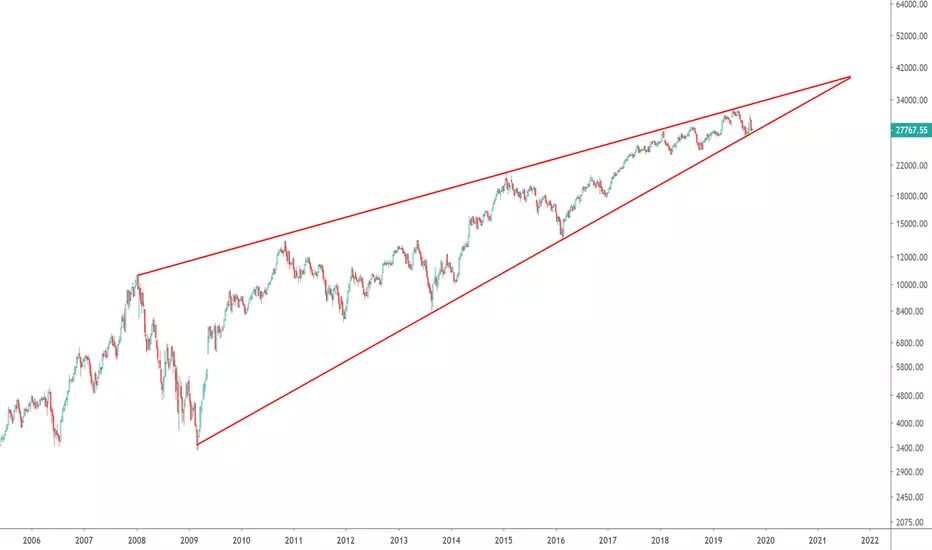
This rising wedge of  BANKNIFTY in LOG scale starts from 2008 and is active even today on October of 2019. The scale of this chart pattern is now more than 10 years which is massive in terms of time and this can only increase the significance of the chart pattern. As you can see from the chart the bottom support line has never been broken on a closing basis. I am not forecasting any trade here, but the break of this wedge to the bottom will definitely not support the current bullishness in the Indian market after the Corporate tax cuts.
I will update this if and once we break any of the two lines.
Follow us on Twitter
BANKNIFTY in LOG scale starts from 2008 and is active even today on October of 2019. The scale of this chart pattern is now more than 10 years which is massive in terms of time and this can only increase the significance of the chart pattern. As you can see from the chart the bottom support line has never been broken on a closing basis. I am not forecasting any trade here, but the break of this wedge to the bottom will definitely not support the current bullishness in the Indian market after the Corporate tax cuts. I will update this if and once we break any of the two lines.
Follow us on Twitter
交易开始
Bottom line is still acting as support.
Ideas for educational purposes only.
免责声明
这些信息和出版物并非旨在提供,也不构成TradingView提供或认可的任何形式的财务、投资、交易或其他类型的建议或推荐。请阅读使用条款了解更多信息。
Ideas for educational purposes only.
免责声明
这些信息和出版物并非旨在提供,也不构成TradingView提供或认可的任何形式的财务、投资、交易或其他类型的建议或推荐。请阅读使用条款了解更多信息。