
Hello,
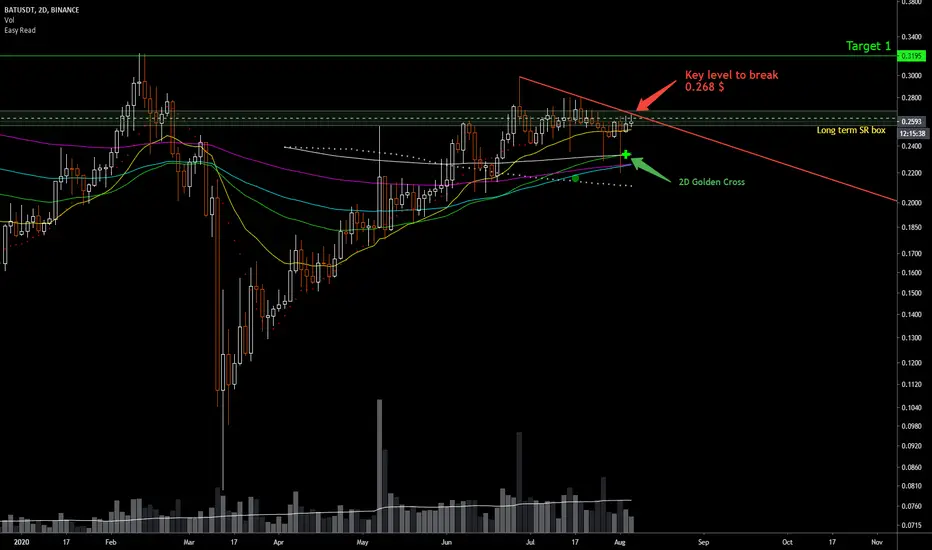
Here we have 2D chart for BAT, we now have confirmed 2D golden cross and BAT is approaching key long term SR levels. I would like to see a clean break above 0.268$ level and then we can head for two key targets on the upside.

If we see BAT break above 0.44$ then it will be in a blue sky break out and can reach higher level with strong FOMO kicking in. But for now I am going step-by-step :)
Happy and safe trading...
chao...
Here we have 2D chart for BAT, we now have confirmed 2D golden cross and BAT is approaching key long term SR levels. I would like to see a clean break above 0.268$ level and then we can head for two key targets on the upside.
If we see BAT break above 0.44$ then it will be in a blue sky break out and can reach higher level with strong FOMO kicking in. But for now I am going step-by-step :)
Happy and safe trading...
chao...

免责声明
这些信息和出版物并非旨在提供,也不构成TradingView提供或认可的任何形式的财务、投资、交易或其他类型的建议或推荐。请阅读使用条款了解更多信息。
免责声明
这些信息和出版物并非旨在提供,也不构成TradingView提供或认可的任何形式的财务、投资、交易或其他类型的建议或推荐。请阅读使用条款了解更多信息。