
Bic has a p/e ratio of 6.5. 4.7% dividend yield.
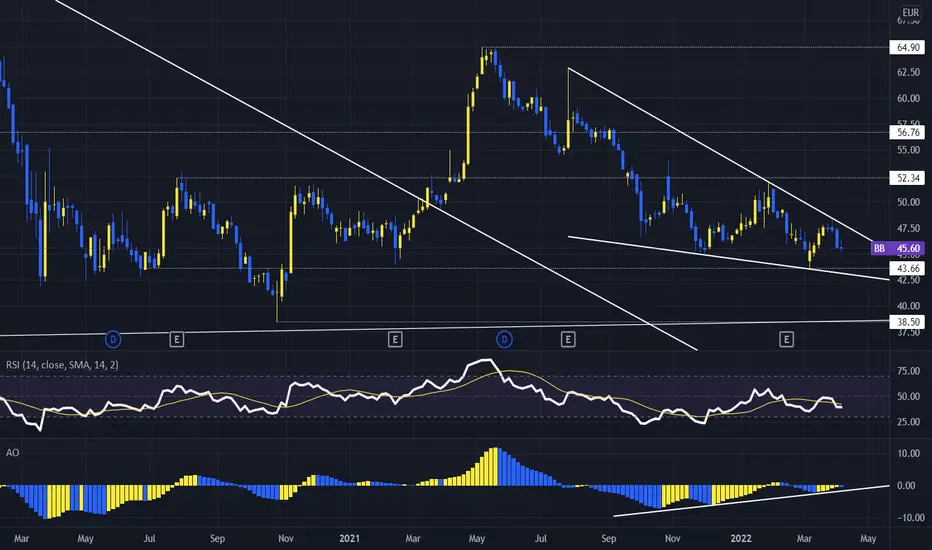
Has been down trending since 2015 and is now range bound with a high of 64.9 and a low of 38.5.
Printing a falling wedge which is a bullish reversal pattern.
RSI struggling with breaking into bullish territory at the 50 level.
AO showing bullish divergence and no real momentum.
Key levels indicated by horizontals show support and resistance.
Will tag on monthly analysis.
Has been down trending since 2015 and is now range bound with a high of 64.9 and a low of 38.5.
Printing a falling wedge which is a bullish reversal pattern.
RSI struggling with breaking into bullish territory at the 50 level.
AO showing bullish divergence and no real momentum.
Key levels indicated by horizontals show support and resistance.
Will tag on monthly analysis.
注释
Close to the bottom of macro channel. Hopefully will be able to buy on the channel otherwise watch out for falling wedge breakout.
注释
Solid 20+% gain after entry.RSI oversold on the day.
Multiple bear divs on lower tf.
Taking some off the table into strength here as we come into resistance.

免责声明
这些信息和出版物并非旨在提供,也不构成TradingView提供或认可的任何形式的财务、投资、交易或其他类型的建议或推荐。请阅读使用条款了解更多信息。
免责声明
这些信息和出版物并非旨在提供,也不构成TradingView提供或认可的任何形式的财务、投资、交易或其他类型的建议或推荐。请阅读使用条款了解更多信息。