
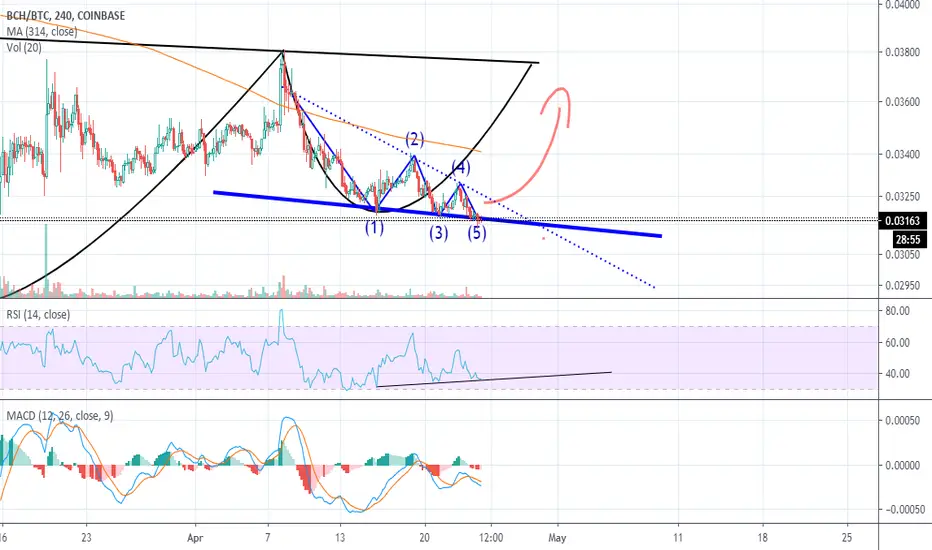
It looks like bch has completed a falling wedge pattern, which is often bullish.
The pattern is interesting because there is triple bullish divergence on the RSI, the price in satoshi is dropping, but the momentum isn't following to the downside. A bounce could be incoming. This combined with the btc halving could see bch propel higher.
IF it breaks the dotted line (resistance line), then it's highly likely that bch will complete the inverse head and shoulders reversal pattern.
The same structure can be observed in other coins as well, such as ETC.
As usual the post is for educational purpose only. :)

免责声明
这些信息和出版物并非旨在提供,也不构成TradingView提供或认可的任何形式的财务、投资、交易或其他类型的建议或推荐。请阅读使用条款了解更多信息。
免责声明
这些信息和出版物并非旨在提供,也不构成TradingView提供或认可的任何形式的财务、投资、交易或其他类型的建议或推荐。请阅读使用条款了解更多信息。