
Hello Traders,
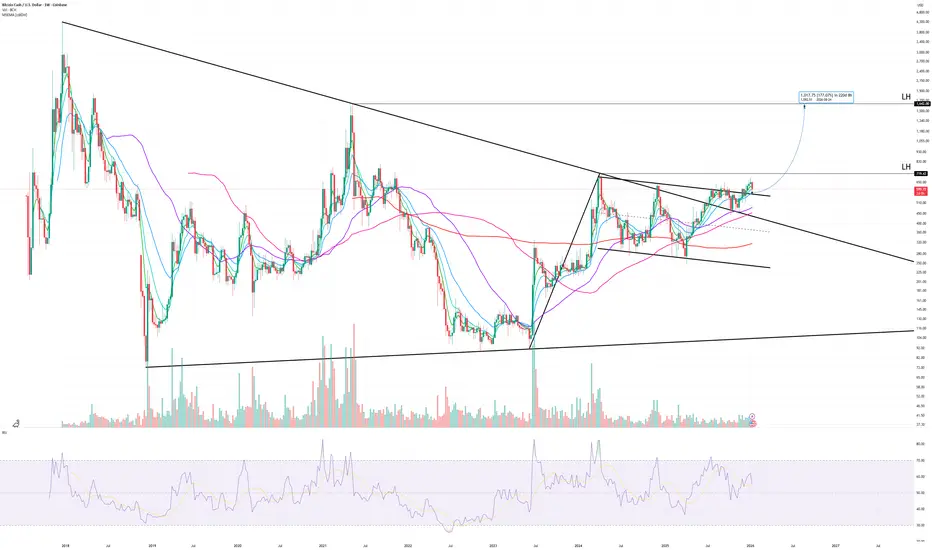
Here is my chart for Bitcoin Cash BCH. As you can see it looks like the price has broken out of a symmetrical triangle and has bounced on top of the top trendline of the symmetrical triangle which is a bullish sign.
Also the price looks to have formed a bull flag as the price has broken the top trendline of the symmetrical triangle and the price looks to be pushing up from the bull flag. Momentum looks good on the RSI as well with the monthly reading 61.5 (middle ground) , weekly 55.5 (middle) and the daily RSI at 47 (below middle). The 4hr RSI is at 44. The reason I am saying this is when I have watched the price break out of something before and the RSI is already into overbought territory so +70 on any timeframe its likely the price has topped and its a false breakout.
Anyway, it looks like the price wants to go up from here. If the price goes up and breaks the previous LH with conviction then my target is the other LH at $1642.
Lets see what happens.
Here is my chart for Bitcoin Cash BCH. As you can see it looks like the price has broken out of a symmetrical triangle and has bounced on top of the top trendline of the symmetrical triangle which is a bullish sign.
Also the price looks to have formed a bull flag as the price has broken the top trendline of the symmetrical triangle and the price looks to be pushing up from the bull flag. Momentum looks good on the RSI as well with the monthly reading 61.5 (middle ground) , weekly 55.5 (middle) and the daily RSI at 47 (below middle). The 4hr RSI is at 44. The reason I am saying this is when I have watched the price break out of something before and the RSI is already into overbought territory so +70 on any timeframe its likely the price has topped and its a false breakout.
Anyway, it looks like the price wants to go up from here. If the price goes up and breaks the previous LH with conviction then my target is the other LH at $1642.
Lets see what happens.
注释
Here is the daily chart. You can see up close that the price has gone up past the sym tri resistance and is breaking up past the bull flag formation. The moving averages also look great here. As I have said a move up from the previous LH with conviction is bullish.注释
Price did not go past the LH. I think its going to retrace to the bottom trend line. 
免责声明
这些信息和出版物并非旨在提供,也不构成TradingView提供或认可的任何形式的财务、投资、交易或其他类型的建议或推荐。请阅读使用条款了解更多信息。