
Hello Traders!
Welcome to another update,
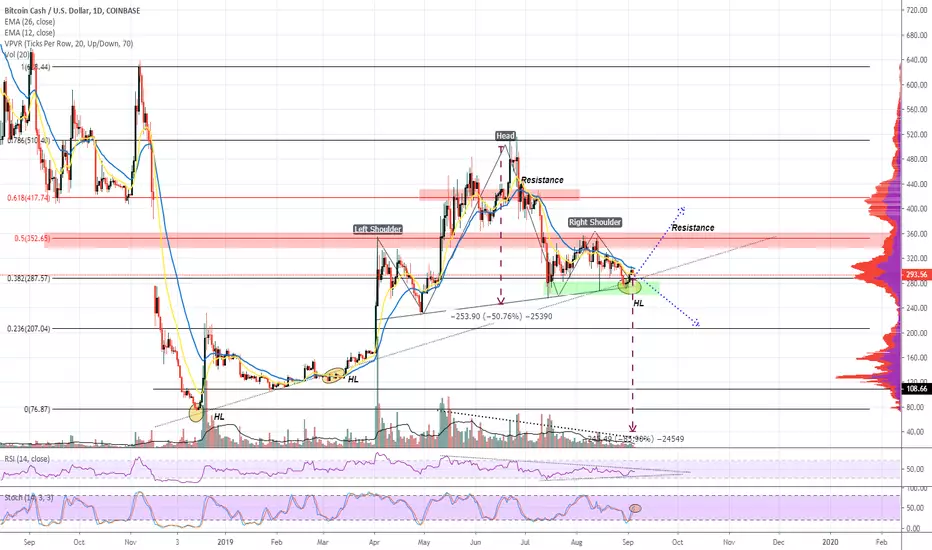
Today’s analysis will be on BCHUSD, a potential head and shoulders!
Points to consider,
- Overall up trend, putting in higher lows
- Price currently testing support and potential neckline
- RSI coming into tightening apex
- Stoch in neutral area
- EMA’s acting as resistance at current given time
- Volume tapering off on right shoulder
- The .50 and .618 Fibonacci has acted as resistance to price
BCHUSD may well be forming a head and shoulders pattern that could be on the verge of breaking bearish. Price is currently testing the upwards support line which is in confluence with the .382 Fibonacci and local support zone.
The RSI is in a equilibrium, coming into its apex, it will break in the near future, whilst the stochs currently neutral, momentum could go either way…
EMA’s are currently giving price strong resistance at current given time; there is so much confluence in this area proving that a break is imminent!
A break bullish will push price to retest previous resistance zones, which are the, .5 and .618 Fibonacci zones respectively. A break bearish could see BCHUSD tank to and below yearly lows…
What are your thoughts, will BCHUSD head and shoulders pattern come to fruition?
Please leave a like and comment
And remember,
“Focus, patience, wise discernment, non-attachment —the skills you acquire in meditation and the skills you need to thrive in trading are one and the same.”Yvan Byeajee
Welcome to another update,
Today’s analysis will be on BCHUSD, a potential head and shoulders!
Points to consider,
- Overall up trend, putting in higher lows
- Price currently testing support and potential neckline
- RSI coming into tightening apex
- Stoch in neutral area
- EMA’s acting as resistance at current given time
- Volume tapering off on right shoulder
- The .50 and .618 Fibonacci has acted as resistance to price
BCHUSD may well be forming a head and shoulders pattern that could be on the verge of breaking bearish. Price is currently testing the upwards support line which is in confluence with the .382 Fibonacci and local support zone.
The RSI is in a equilibrium, coming into its apex, it will break in the near future, whilst the stochs currently neutral, momentum could go either way…
EMA’s are currently giving price strong resistance at current given time; there is so much confluence in this area proving that a break is imminent!
A break bullish will push price to retest previous resistance zones, which are the, .5 and .618 Fibonacci zones respectively. A break bearish could see BCHUSD tank to and below yearly lows…
What are your thoughts, will BCHUSD head and shoulders pattern come to fruition?
Please leave a like and comment
And remember,
“Focus, patience, wise discernment, non-attachment —the skills you acquire in meditation and the skills you need to thrive in trading are one and the same.”Yvan Byeajee

Join the Free Trading Group
Telegram: t.me/freetradingden 🔥
Claim $1000 Deposit Bonus 🎁
Trade with perks & support the community!
partner.blofin.com/d/TheAlchemist
Stay sharp, trade smart.
— Team The Alchemist ⚔️
Telegram: t.me/freetradingden 🔥
Claim $1000 Deposit Bonus 🎁
Trade with perks & support the community!
partner.blofin.com/d/TheAlchemist
Stay sharp, trade smart.
— Team The Alchemist ⚔️
免责声明
这些信息和出版物并非旨在提供,也不构成TradingView提供或认可的任何形式的财务、投资、交易或其他类型的建议或推荐。请阅读使用条款了解更多信息。
Join the Free Trading Group
Telegram: t.me/freetradingden 🔥
Claim $1000 Deposit Bonus 🎁
Trade with perks & support the community!
partner.blofin.com/d/TheAlchemist
Stay sharp, trade smart.
— Team The Alchemist ⚔️
Telegram: t.me/freetradingden 🔥
Claim $1000 Deposit Bonus 🎁
Trade with perks & support the community!
partner.blofin.com/d/TheAlchemist
Stay sharp, trade smart.
— Team The Alchemist ⚔️
免责声明
这些信息和出版物并非旨在提供,也不构成TradingView提供或认可的任何形式的财务、投资、交易或其他类型的建议或推荐。请阅读使用条款了解更多信息。