
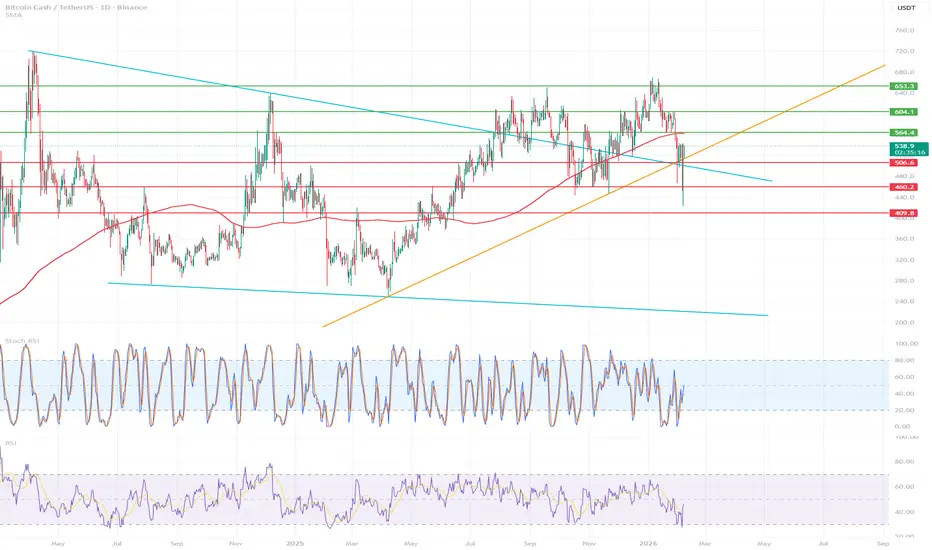
🧭 Market Structure (HTF – Daily)
📉 Trend
Long-term: uptrend (orange trend line)
Medium-term: correction in an uptrend
Currently, the price has broken the local HH → HL structure and returned to important levels.
This is NOT a downtrend reversal yet, but a warning.
🧱 Key Levels (you've got this one figured out)
🟢 Resistance
564 USDT – mega-important (local S/R + trend intersection)
604 USDT
653 USDT – main HTF resistance
No D1 close above 564 → no confirmation of bullish strength.
🔴 Supports
506 USDT – currently being tested (local S/R)
460 USDT – very strong support (reactions + structure)
409 USDT – last line of defense, things get ugly below
📐 Trendlines
The blue bearish (HTF) has been rejected
The price has fallen below the crossover:
uptrend
MA (red)
👉 This is a classic corrective signal, not a panic signal.
📊 RSI & Stoch RSI
RSI (lower panel)
RSI ~ 40
Not oversold yet
No bullish divergence on D1
➡️ There is room for a further decline before a strong bounce occurs.
Stoch RSI
Often in extreme zones → nervous market
Currently not giving a clear long signal
🔮 Scenarios (most important)
🟡 Baseline scenario (most likely)
Consolidation / drop to:
460 USDT
There:
demand reaction
potential higher low
Only then an attempt to attack 564 → 604
👉 A healthy correction in the uptrend.
🔴 Negative scenario
Daily close < 460
Then:
quick move to 409
deeper accumulation possible
This would be a signal of medium-term weakness.
🟢 Bullish scenario (less likely NOW)
Quick return above:
506 → 540
Daily close > 564
Targets:
604
653
Without this, every raise is a pullback.
📉 Trend
Long-term: uptrend (orange trend line)
Medium-term: correction in an uptrend
Currently, the price has broken the local HH → HL structure and returned to important levels.
This is NOT a downtrend reversal yet, but a warning.
🧱 Key Levels (you've got this one figured out)
🟢 Resistance
564 USDT – mega-important (local S/R + trend intersection)
604 USDT
653 USDT – main HTF resistance
No D1 close above 564 → no confirmation of bullish strength.
🔴 Supports
506 USDT – currently being tested (local S/R)
460 USDT – very strong support (reactions + structure)
409 USDT – last line of defense, things get ugly below
📐 Trendlines
The blue bearish (HTF) has been rejected
The price has fallen below the crossover:
uptrend
MA (red)
👉 This is a classic corrective signal, not a panic signal.
📊 RSI & Stoch RSI
RSI (lower panel)
RSI ~ 40
Not oversold yet
No bullish divergence on D1
➡️ There is room for a further decline before a strong bounce occurs.
Stoch RSI
Often in extreme zones → nervous market
Currently not giving a clear long signal
🔮 Scenarios (most important)
🟡 Baseline scenario (most likely)
Consolidation / drop to:
460 USDT
There:
demand reaction
potential higher low
Only then an attempt to attack 564 → 604
👉 A healthy correction in the uptrend.
🔴 Negative scenario
Daily close < 460
Then:
quick move to 409
deeper accumulation possible
This would be a signal of medium-term weakness.
🟢 Bullish scenario (less likely NOW)
Quick return above:
506 → 540
Daily close > 564
Targets:
604
653
Without this, every raise is a pullback.

免责声明
这些信息和出版物并非旨在提供,也不构成TradingView提供或认可的任何形式的财务、投资、交易或其他类型的建议或推荐。请阅读使用条款了解更多信息。
免责声明
这些信息和出版物并非旨在提供,也不构成TradingView提供或认可的任何形式的财务、投资、交易或其他类型的建议或推荐。请阅读使用条款了解更多信息。