BCNBTC Trading Idea
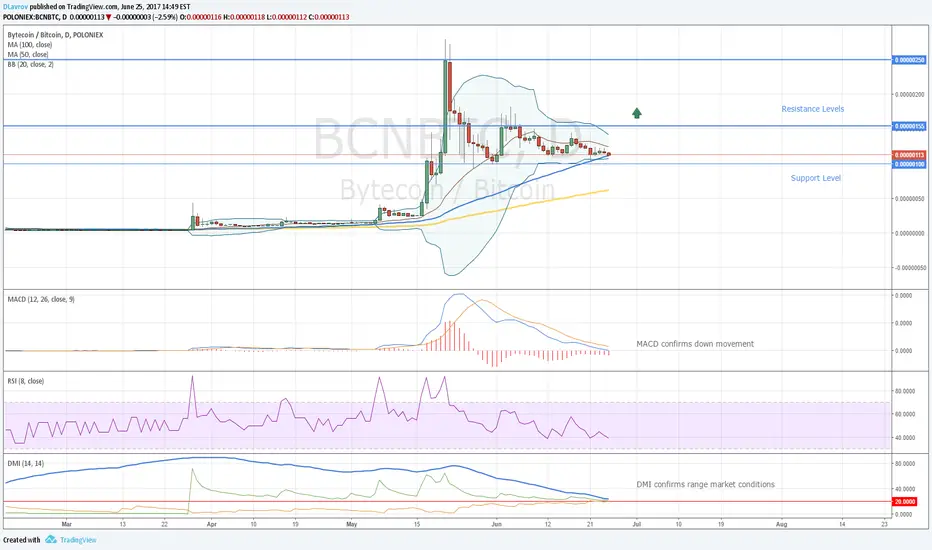
Let's look at the daily chart of BCNBTC and try to understand how we should trade this pair. We have to note that the market is in an up trend but presently we can see a correction wave. It's confirmed by price movement between the resistance and the support levels and DMI indicator. It will be correctly to wait for a new impulse wave and only after that join the up trend. We should open long trades only if price breaks the 1st resistance level and ADX line rises above 20 level. MACD will have to support this up movement. Profit target for long trades must be at the 2nd resistance level. If price breaks the support level and MA50, we'll see down movement to MA100 (yellow line). If the market bounces from MA100, it will be a new long opportunity with profit targets at the resistance levels.
P.S. If you think this information can be useful, please, like it and share. Also I will be glad to read your comments )
P.S. If you think this information can be useful, please, like it and share. Also I will be glad to read your comments )

💰COPY MY TRADES FOR FREE! Join 👉 bit.ly/41DKDBD
📣 Get Welcome Bonuses for 1st Trade 👉 bit.ly/bonus_bybit
💎 Share My BEST Trades here 👉 bit.ly/wubits
📣 Get Welcome Bonuses for 1st Trade 👉 bit.ly/bonus_bybit
💎 Share My BEST Trades here 👉 bit.ly/wubits
免责声明
这些信息和出版物并非旨在提供,也不构成TradingView提供或认可的任何形式的财务、投资、交易或其他类型的建议或推荐。请阅读使用条款了解更多信息。
💰COPY MY TRADES FOR FREE! Join 👉 bit.ly/41DKDBD
📣 Get Welcome Bonuses for 1st Trade 👉 bit.ly/bonus_bybit
💎 Share My BEST Trades here 👉 bit.ly/wubits
📣 Get Welcome Bonuses for 1st Trade 👉 bit.ly/bonus_bybit
💎 Share My BEST Trades here 👉 bit.ly/wubits
免责声明
这些信息和出版物并非旨在提供,也不构成TradingView提供或认可的任何形式的财务、投资、交易或其他类型的建议或推荐。请阅读使用条款了解更多信息。