
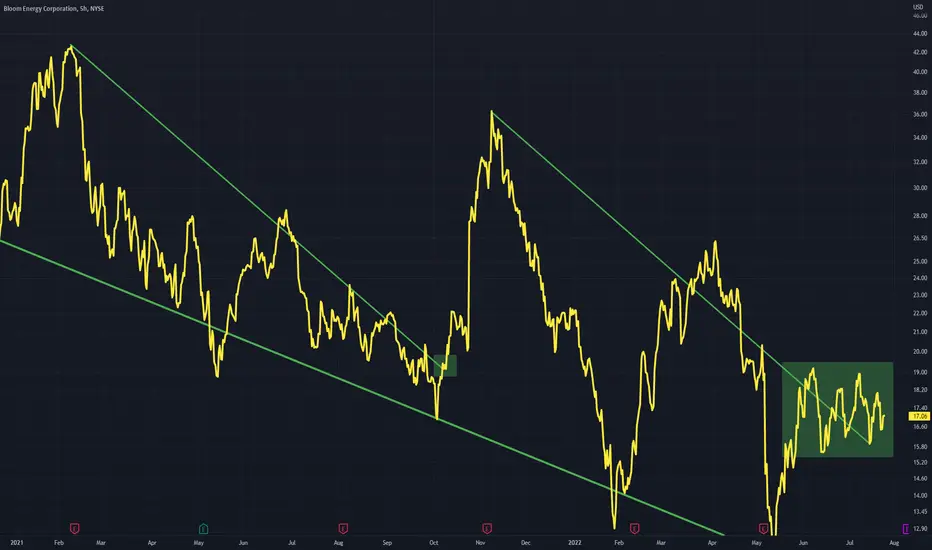
Two falling wedges can be drawn on chart
The first showing a successful breakout, leading to the peak of the second falling wedge
This second falling wedge may not have bottomed but the break out should occur along the green downtrend line
The first showing a successful breakout, leading to the peak of the second falling wedge
This second falling wedge may not have bottomed but the break out should occur along the green downtrend line

免责声明
这些信息和出版物并非旨在提供,也不构成TradingView提供或认可的任何形式的财务、投资、交易或其他类型的建议或推荐。请阅读使用条款了解更多信息。