
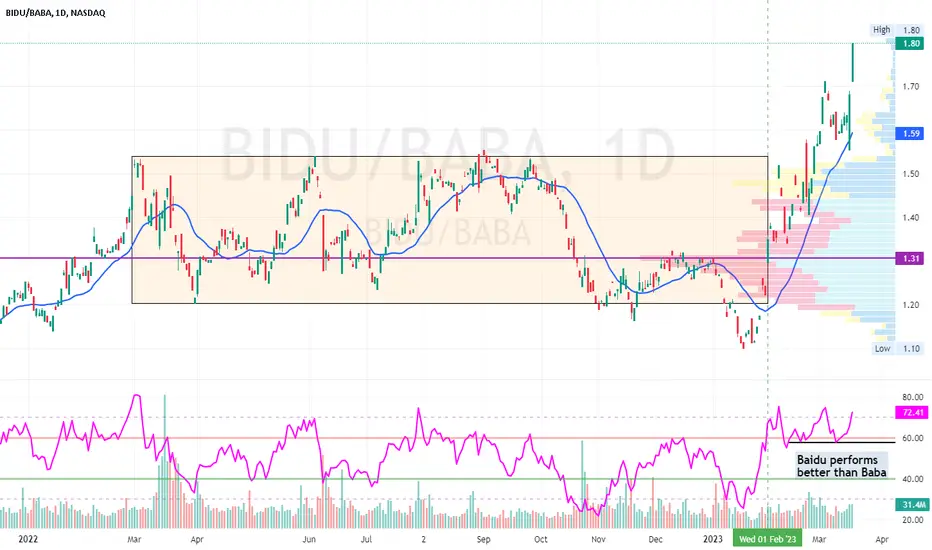
One year Daily Chart
a simple comparison by dividing #BIDU / #BABA
The ratio has been kept mostly within 1.20 ~ 1.5+
Daily RSI starts to surpass 60, which potentially starts a bullish move
*** in this case, meaning Baidu will potentially starts to outperform Baba for quite sometime)
The ratio finally surpass 1.50+ again and has since mark a new High
RSI continues to stays along high levels
so long RSI did not break below leveled support, Baidu will perform better than Baba
a simple comparison by dividing #BIDU / #BABA
The ratio has been kept mostly within 1.20 ~ 1.5+
Daily RSI starts to surpass 60, which potentially starts a bullish move
*** in this case, meaning Baidu will potentially starts to outperform Baba for quite sometime)
The ratio finally surpass 1.50+ again and has since mark a new High
RSI continues to stays along high levels
so long RSI did not break below leveled support, Baidu will perform better than Baba
注释
a total reversal! now Baba is better, ratio may gradualy drop back along 1.2 area
免责声明
这些信息和出版物并非旨在提供,也不构成TradingView提供或认可的任何形式的财务、投资、交易或其他类型的建议或推荐。请阅读使用条款了解更多信息。