做多
BLOKUSDT
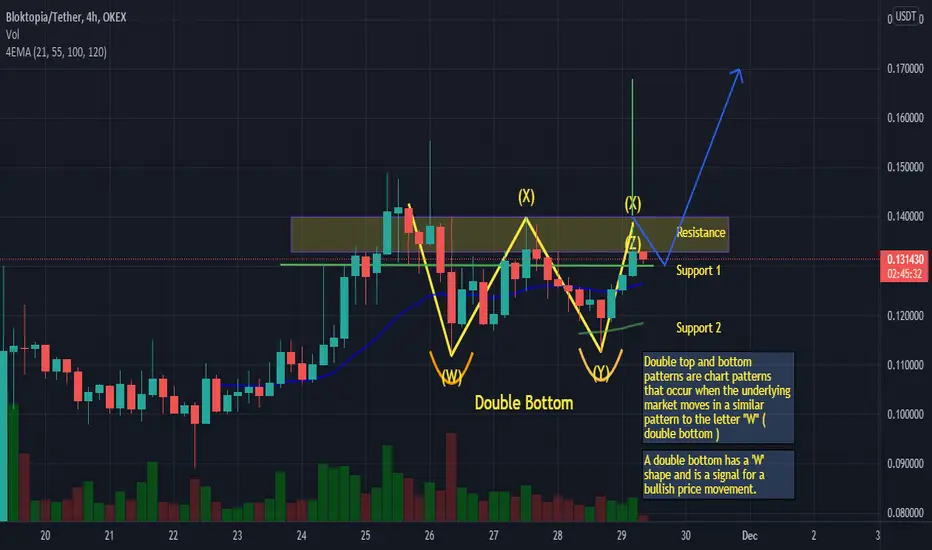
Double top and bottom patterns are chart patterns that occur when the underlying market moves in a similar pattern to the letter "W" ( double bottom )
A double bottom has a 'W' shape and is a signal for a bullish price movement.
If BLOK breaks R1 Region 0.13000-0.14000
Then
it can go to 0.17000-0.20000
A double bottom has a 'W' shape and is a signal for a bullish price movement.
If BLOK breaks R1 Region 0.13000-0.14000
Then
it can go to 0.17000-0.20000

免责声明
这些信息和出版物并非旨在提供,也不构成TradingView提供或认可的任何形式的财务、投资、交易或其他类型的建议或推荐。请阅读使用条款了解更多信息。
免责声明
这些信息和出版物并非旨在提供,也不构成TradingView提供或认可的任何形式的财务、投资、交易或其他类型的建议或推荐。请阅读使用条款了解更多信息。