
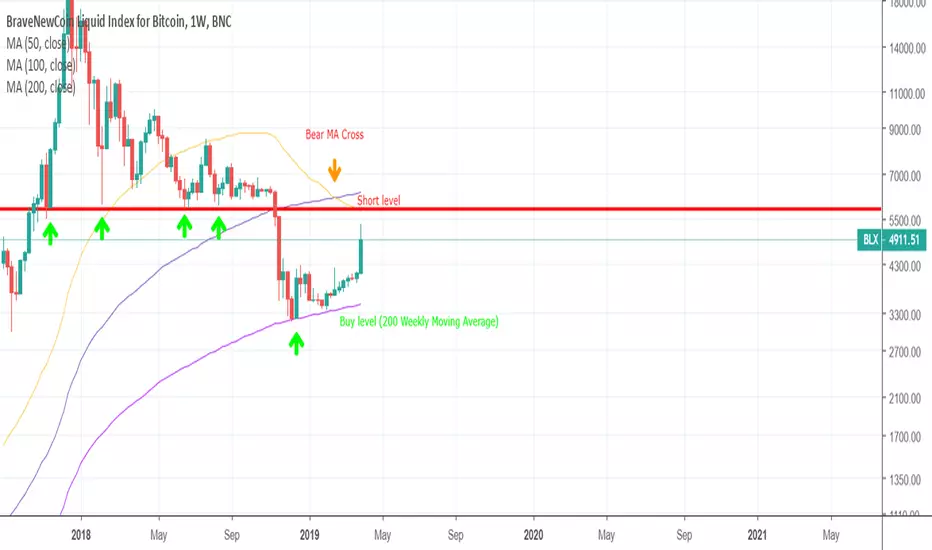
This is the Bitcoin weekly view (BLX chart).
We have seen that the 5800$ level acted as a good support until it was tested for the 5th time in november 2018. Now it is acting as huge resistance and it coincides with the 50 Weekly Moving Average, which also acts a resistance. Furthermore we have seen the bearish MA cross happen already (50 crossed down the 100). The long term support is at the 200 weekly Moving Average.
We have seen that the 5800$ level acted as a good support until it was tested for the 5th time in november 2018. Now it is acting as huge resistance and it coincides with the 50 Weekly Moving Average, which also acts a resistance. Furthermore we have seen the bearish MA cross happen already (50 crossed down the 100). The long term support is at the 200 weekly Moving Average.

免责声明
这些信息和出版物并非旨在提供,也不构成TradingView提供或认可的任何形式的财务、投资、交易或其他类型的建议或推荐。请阅读使用条款了解更多信息。
免责声明
这些信息和出版物并非旨在提供,也不构成TradingView提供或认可的任何形式的财务、投资、交易或其他类型的建议或推荐。请阅读使用条款了解更多信息。