
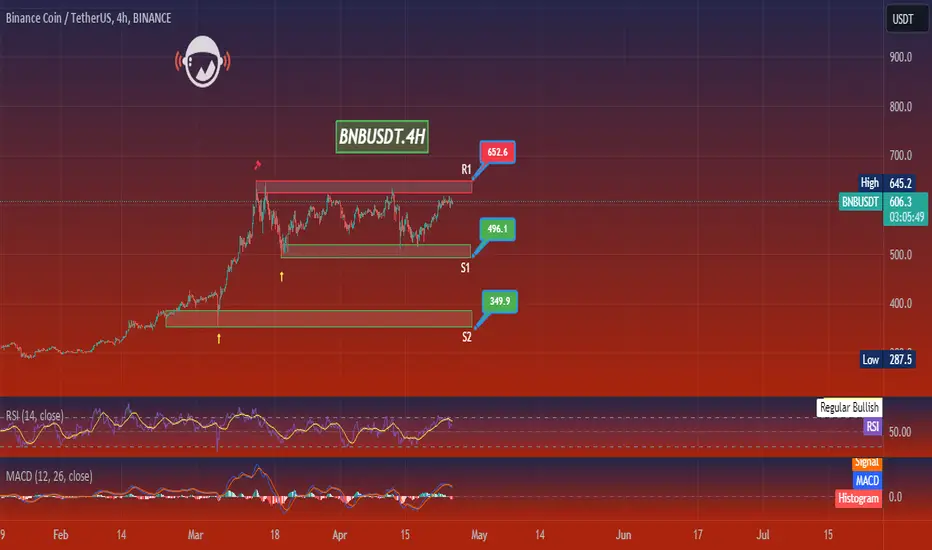
In the 4-hour chart for Binance Coin (BNB/USDT), BNB is trading within a range, with price action fluctuating between support and resistance levels. The resistance (R1) at $652.6 represents the upper boundary of the range, while the support (S1) at $496.1 acts as the lower boundary. There's an additional support level (S2) at $349.9, marked by earlier price interactions.
The current price is at $606.1. The RSI is at a neutral 58.56, suggesting that there's room for movement in either direction without being in the overbought or oversold territory. The MACD is hovering around the signal line, indicating a balance between buyers and sellers with no clear momentum.
For traders, watching for a breakout above R1 could provide a bullish signal, while a break below S1 might suggest bearish momentum. The strategy could involve entering trades following a bounce from S1 or a breakout above R1, with appropriate risk management measures such as stop-loss orders. Confirmation from trading volume would strengthen the signal for entry.

免责声明
这些信息和出版物并非旨在提供,也不构成TradingView提供或认可的任何形式的财务、投资、交易或其他类型的建议或推荐。请阅读使用条款了解更多信息。
免责声明
这些信息和出版物并非旨在提供,也不构成TradingView提供或认可的任何形式的财务、投资、交易或其他类型的建议或推荐。请阅读使用条款了解更多信息。