
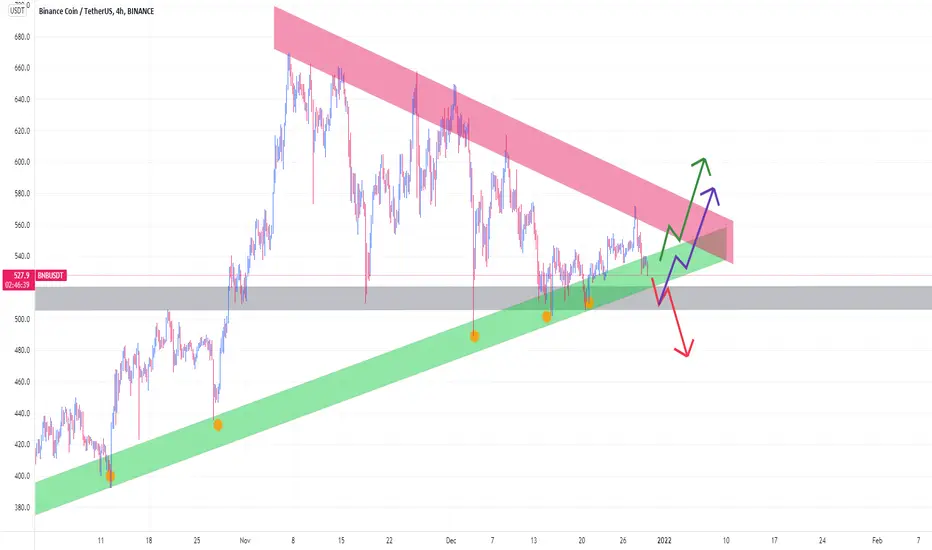
BNBUSDT has formed a huge triangle, with a very strong longstanding trendline that has seen 7 significant rejections since June.
Price is currently testing that lower trendline after a series of lower lows have driven us into a consolidating triangle. Expect price to break sharply out of this triangle.
Immediately below the bottom trendline is an area that has also acted as strong support recently, which could set up for a potential fakeout - a sharp break below the trendline only to meet support and bounce right back through the top side of our triangle (shown as the purple line on the chart).
Short term expectation is to see a bounce unless we see a break below the lower support level, in which case we could expect to see a drop to the low 400s.
This is not financial advice. You are responsible for your own trading decisions.
Comment your idea below, give a like and follow for more!
Price is currently testing that lower trendline after a series of lower lows have driven us into a consolidating triangle. Expect price to break sharply out of this triangle.
Immediately below the bottom trendline is an area that has also acted as strong support recently, which could set up for a potential fakeout - a sharp break below the trendline only to meet support and bounce right back through the top side of our triangle (shown as the purple line on the chart).
Short term expectation is to see a bounce unless we see a break below the lower support level, in which case we could expect to see a drop to the low 400s.
This is not financial advice. You are responsible for your own trading decisions.
Comment your idea below, give a like and follow for more!

免责声明
这些信息和出版物并非旨在提供,也不构成TradingView提供或认可的任何形式的财务、投资、交易或其他类型的建议或推荐。请阅读使用条款了解更多信息。
免责声明
这些信息和出版物并非旨在提供,也不构成TradingView提供或认可的任何形式的财务、投资、交易或其他类型的建议或推荐。请阅读使用条款了解更多信息。