
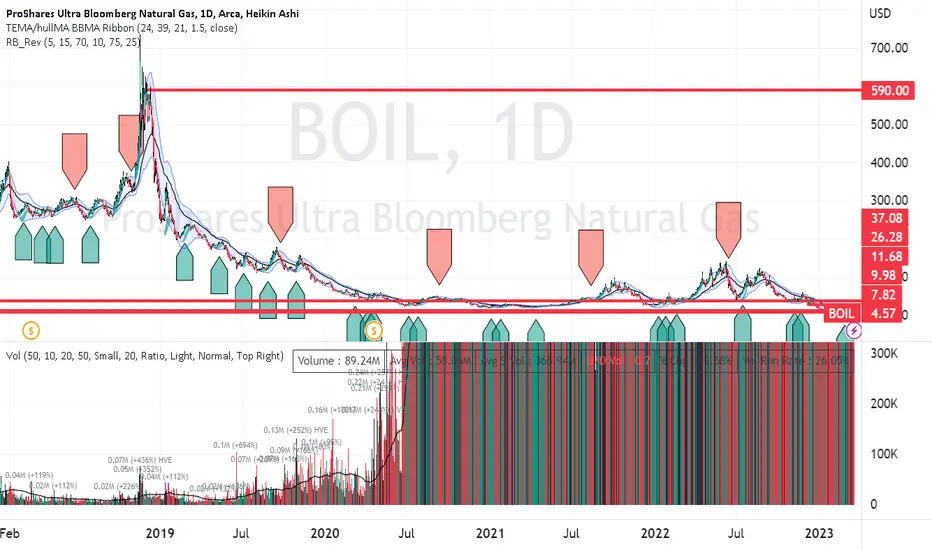
On the daily chart, BOIL price has never been lower and the relative volume has never
been higher in the past five years. Being mindful, this is leveraged it falls faster than an
the unleveraged counterpart of the same commodity ( UNG INL) However moves in the
opposite directions are also amplified. Horizontal red lines are drawn in consideration
of pivots on the 4H. Price was nearly $600 in 2019. Can you think of a fundamental
reason why price cannot rise from the present price to something closer to that
of 2019. To go from $4 to $600 is 150X in otherwords 15000%. Is there anything
wrong with my math or the chart?
been higher in the past five years. Being mindful, this is leveraged it falls faster than an
the unleveraged counterpart of the same commodity ( UNG INL) However moves in the
opposite directions are also amplified. Horizontal red lines are drawn in consideration
of pivots on the 4H. Price was nearly $600 in 2019. Can you think of a fundamental
reason why price cannot rise from the present price to something closer to that
of 2019. To go from $4 to $600 is 150X in otherwords 15000%. Is there anything
wrong with my math or the chart?
交易开始
For a math exercise, suppose an equity price increases 2% per trading day and then compounds for 125 trading days or six months. What is the resulting total value of return given for instance $100 in initial shares? The answer might surprise you depending on how mathematically astute you might be.交易开始
Just got a pop from the fed news of a rate hike.
免责声明
这些信息和出版物并非旨在提供,也不构成TradingView提供或认可的任何形式的财务、投资、交易或其他类型的建议或推荐。请阅读使用条款了解更多信息。
免责声明
这些信息和出版物并非旨在提供,也不构成TradingView提供或认可的任何形式的财务、投资、交易或其他类型的建议或推荐。请阅读使用条款了解更多信息。