
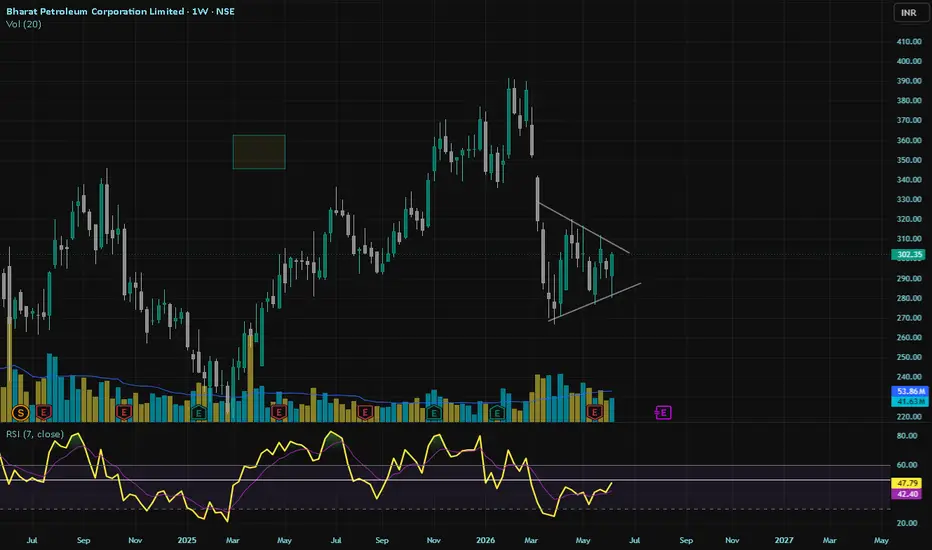
BPCL -
Daily Time Frame (DTF)
Volatility is getting compressed and new insider candle developed ( yellow triangle ) and price crossed above it . RSI(7) @ 63 and above RSI -EMA - showing bullish .
Weekly TF
Volatility is getting compressed and new insider candle developed ( yellow triangle ) . RSI(7) above RSI -EMA - showing bullish . Also Bullish indicator activated (Green triangle).
If geopolitical conditions supporting , it looks overall a nice buildup.
Cautionary note: Support / resistance levels may vary based on market conditions .so this is not a recommendation to buy or sell, but rather a signal to watch the stock for future trading opportunities.
It's essential to monitor the stock in the coming days to see if the price action fits your entry criteria and aligns with your strategy.
disclaimer :This is not a buy sell recommendation - only for study purpose .

免责声明
这些信息和出版物并非旨在提供,也不构成TradingView提供或认可的任何形式的财务、投资、交易或其他类型的建议或推荐。请阅读使用条款了解更多信息。
免责声明
这些信息和出版物并非旨在提供,也不构成TradingView提供或认可的任何形式的财务、投资、交易或其他类型的建议或推荐。请阅读使用条款了解更多信息。