BQXBTC has Dandruff
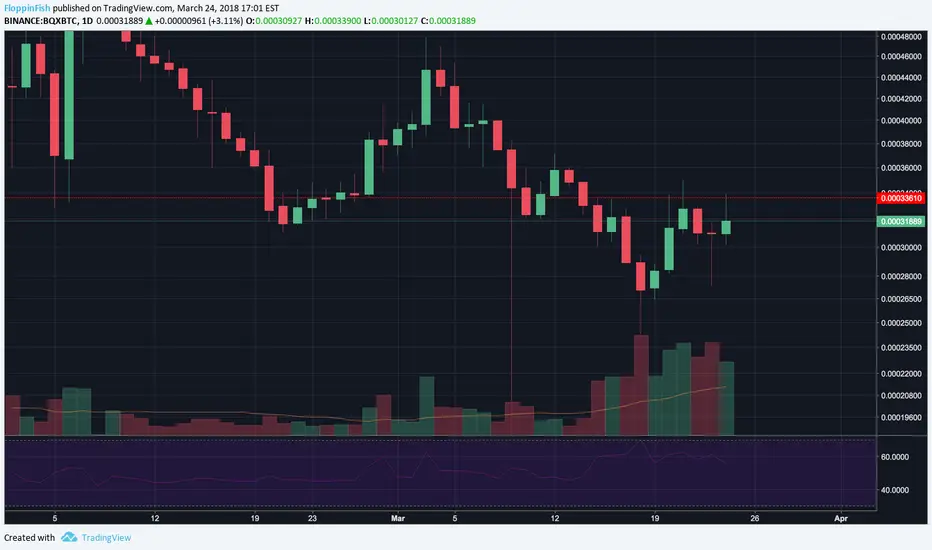
There seems to be a resistance or "dumb zone" @ 33600 SATS. Zoomed in closer to the 2H chart, BQX seems to have formed an inverted head and shoulders pattern. What I'm confused by though, is the volume. Shouldn't the volume indicate a valid H & S pattern? I see 4 bumps in volume, with the 3rd not correlating to a price action. Either way, it's going up or going down. I'll put in stop-losses.


免责声明
这些信息和出版物并非旨在提供,也不构成TradingView提供或认可的任何形式的财务、投资、交易或其他类型的建议或推荐。请阅读使用条款了解更多信息。
免责声明
这些信息和出版物并非旨在提供,也不构成TradingView提供或认可的任何形式的财务、投资、交易或其他类型的建议或推荐。请阅读使用条款了解更多信息。