
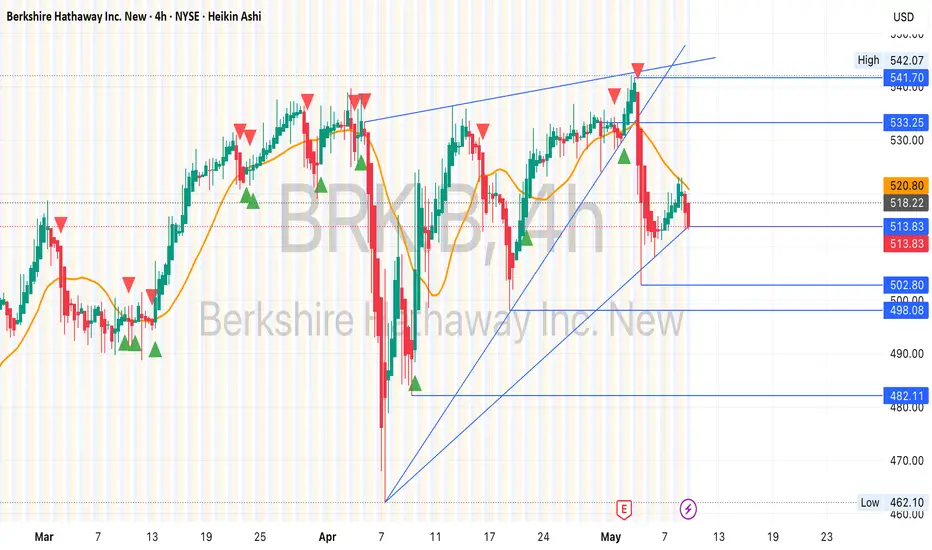
BRK.B 4H Chart Technical Analysis
Trend Context:
The chart shows Berkshire Hathaway (BRK.B) on the 4H timeframe using Heikin Ashi candles. The stock was previously in an ascending channel but has broken below the lower trendline—signaling a potential shift in momentum.
Bearish Signs:
🔻 Channel Breakdown: Price has broken below the rising trendline support, invalidating the prior bullish structure.
🔻 Failed to Hold $520.80 Resistance: The recent bounce failed to sustain above this level.
🔻 Bearish Heikin Ashi Candles: Consecutive red candles with no upper wicks indicate strong downside pressure.
🔻 Bearish EMA Crossover: The orange moving average (likely 9 or 21 EMA) is curling down, which often precedes further downside.
Support & Target Zones:
Immediate support: $513.80 — currently being tested.
Break below this could lead to:
$502.80
$498.08
$482.11
$462.10 (critical swing low)
Bullish Reclaim Needed:
Bulls must reclaim and hold above $520.80, followed by a break above $533.25 to reestablish a bullish bias.
Until then, momentum favors the bears.

免责声明
这些信息和出版物并非旨在提供,也不构成TradingView提供或认可的任何形式的财务、投资、交易或其他类型的建议或推荐。请阅读使用条款了解更多信息。
免责声明
这些信息和出版物并非旨在提供,也不构成TradingView提供或认可的任何形式的财务、投资、交易或其他类型的建议或推荐。请阅读使用条款了解更多信息。