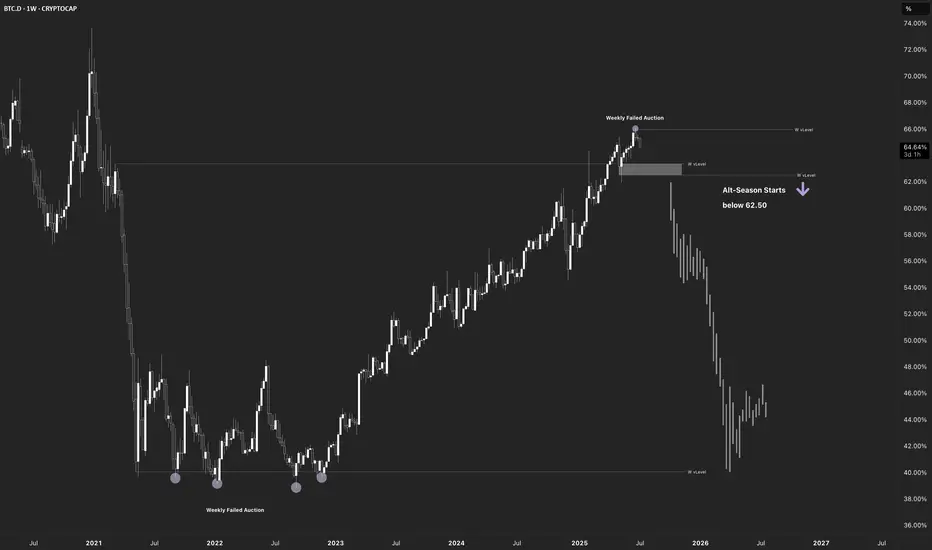
Chart Context
• Instrument: BTC.D
BTC.D
• Time-frame: 1-Week
• *Key vLevels (dashed):
• 68 % – 2021 supply pivot
• 66-68 % zone – recorded a Weekly Failed Auction (wick above, close back below)
• 62.50 % – mid-range support / prior breakout shelf
How I’ll trade / allocate
• Instrument:
BTC.D • Time-frame: 1-Week
• *Key vLevels (dashed):
• 68 % – 2021 supply pivot
• 66-68 % zone – recorded a Weekly Failed Auction (wick above, close back below)
• 62.50 % – mid-range support / prior breakout shelf
- Failed Auction at the Top
- Price wicked into the 66-68 % vLevel but closed lower.
- On a weekly chart that pattern often marks exhaustion; bulls couldn’t maintain control.
- First Support = 62.50 %
- If BTC.D trades < 62.50 % and closes a weekly bar there, odds rise that capital rotates out of BTC and into alt-coins.
- Historically this breakdown triggers the early stages of alt-season (see 2021 analogue).
- Invalidation
- Weekly close > 68 % negates the failed auction and points to renewed BTC strength (alts lag).
How I’ll trade / allocate
- Spot BTC bias – overweight BTC while dominance holds > 62 %.
- Alt-coin rotation – shift 20-35 % into high-conviction alts only after a confirmed weekly close < 62 % and follow-through below 60 %.
- Risk checks – trim alt exposure back to cash/BTC if dominance reclaims 62 % after a breakdown (failed alt-season).

Let's DeCode the markets together,
Bast.
Bast.
免责声明
这些信息和出版物并非旨在提供,也不构成TradingView提供或认可的任何形式的财务、投资、交易或其他类型的建议或推荐。请阅读使用条款了解更多信息。
Let's DeCode the markets together,
Bast.
Bast.
免责声明
这些信息和出版物并非旨在提供,也不构成TradingView提供或认可的任何形式的财务、投资、交易或其他类型的建议或推荐。请阅读使用条款了解更多信息。