
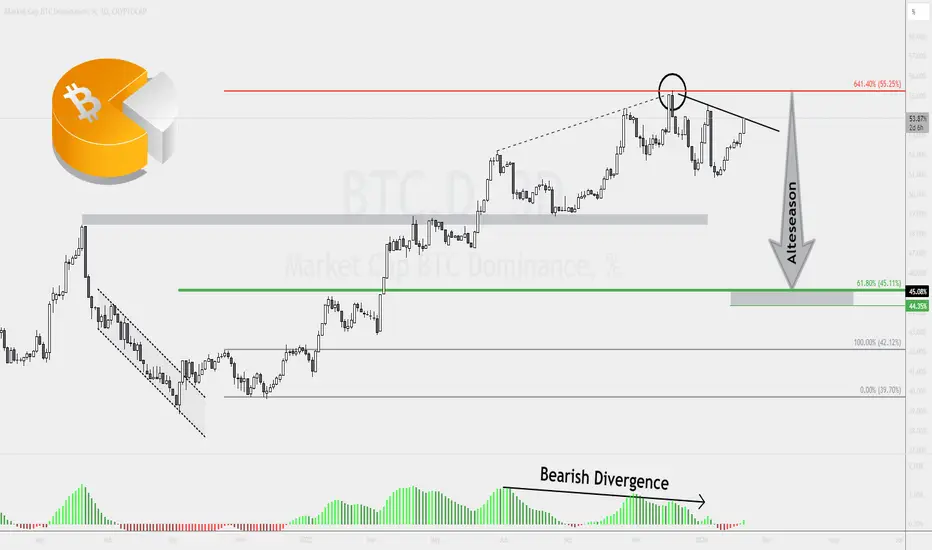
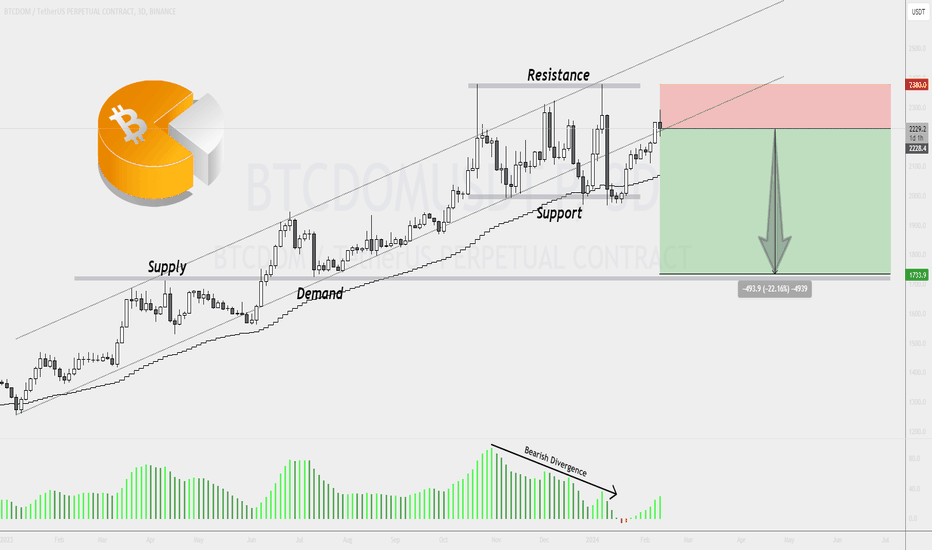
The Bitcoin Dominance chart reveals a bearish divergence on the 3-Day chart, a signal we previously highlighted in our analysis. Since then, BTC.D has engaged in a range-trading dance, marked by the emergence of a Lower Highs and Lower Lows pattern. The plot thickens as BTC.D approaches the downtrend trendline, poised to act as formidable resistance.
Should this trendline hold its ground, especially if the daily close remains below, we anticipate a substantial drop in Bitcoin Dominance. Our eyes are keenly fixed on the key support area ranging between 44-45%, a critical zone aligning with the 61.8% Fibonacci retracement level. Yet, in case of the decline, first we must not overlook the significance of the 49% demand zone.
The broader picture paints a compelling narrative—we stand at the precipice of a potential altcoin rally. The unfolding scenario hints at the very beginning of a transformative phase, with the possibility of many coins doubling in price.
Should this trendline hold its ground, especially if the daily close remains below, we anticipate a substantial drop in Bitcoin Dominance. Our eyes are keenly fixed on the key support area ranging between 44-45%, a critical zone aligning with the 61.8% Fibonacci retracement level. Yet, in case of the decline, first we must not overlook the significance of the 49% demand zone.
The broader picture paints a compelling narrative—we stand at the precipice of a potential altcoin rally. The unfolding scenario hints at the very beginning of a transformative phase, with the possibility of many coins doubling in price.
交易开始

免责声明
这些信息和出版物并非旨在提供,也不构成TradingView提供或认可的任何形式的财务、投资、交易或其他类型的建议或推荐。请阅读使用条款了解更多信息。