
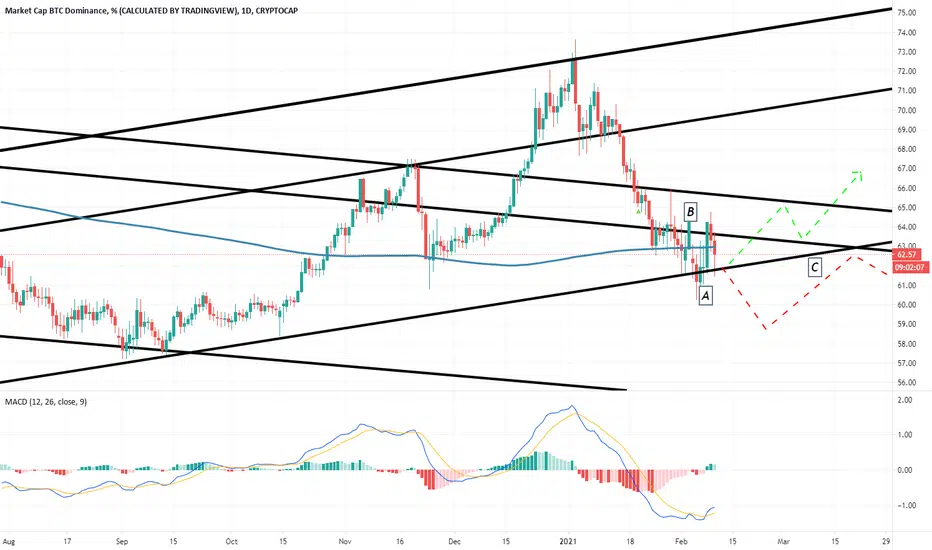
The Bitcoin dominance chart - i.e., the share of Bitcoin's market capitalization in the total crypto market - indicates the importance of the technical momentum that lies ahead in the coming days.
In recent hours, Bitcoin's strong upward movement was driven by the arrival at the support level (A) of the bullish channel that currently governs the movement.
After that bullish reaction, the apex formed by the crossing with a narrow bearish channel (B) was quickly reached and is now moving downwards, compressed by the confluence between both technical figures (C).
If it pierces the figure to the downside, it will signal future weakness of Bitcoin against Altcoins, which could push the Altcoin segment higher.
If, on the other hand, the price movement is bullish and breaks the technical hurdle, Bitcoin can literally fly higher and shatter Bitcoin valuations in the rest of the market.
The daily range MACD shows a profile that supports future developments to either side of the price, although it would be terminal and short-lived if it is a bearish move.

免责声明
这些信息和出版物并非旨在提供,也不构成TradingView提供或认可的任何形式的财务、投资、交易或其他类型的建议或推荐。请阅读使用条款了解更多信息。
免责声明
这些信息和出版物并非旨在提供,也不构成TradingView提供或认可的任何形式的财务、投资、交易或其他类型的建议或推荐。请阅读使用条款了解更多信息。