
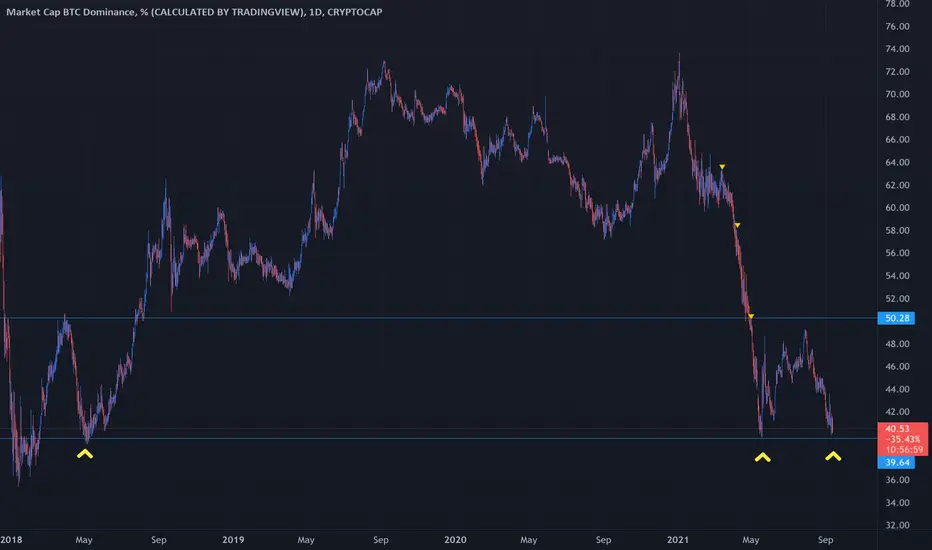
The dominance chart is one of my favourite charts because it pretty much dictates where all the alts are going. BTC has had an AMAZING run since last December, and now its time for alts and BTC to dip. The support level that is tapping and has yet to hit (should hit in the next couple of days or so) is the same of 2018, The second tap usually signal an inversion of the dominance trend, and makes alts bleed.
At the moment BTC has broken the 9 and 21 EMA lines is testing the 50 EMA on the daily time frame, and should be retesting the 200 EMA support on the 4h chart. If the dominance increases in confluence with the BTC dip, it will make last dip look like a walk in the park. Also September is usually a bad month for crypto.
In my opinion we should have one last pump and then we are done with the bulls until the next halving as markets should resume the dip for the next couple of years or so.
So my prediction is short term is Bullish for the next couple of day, long term Bearish.

免责声明
这些信息和出版物并非旨在提供,也不构成TradingView提供或认可的任何形式的财务、投资、交易或其他类型的建议或推荐。请阅读使用条款了解更多信息。
免责声明
这些信息和出版物并非旨在提供,也不构成TradingView提供或认可的任何形式的财务、投资、交易或其他类型的建议或推荐。请阅读使用条款了解更多信息。