
Market Overview
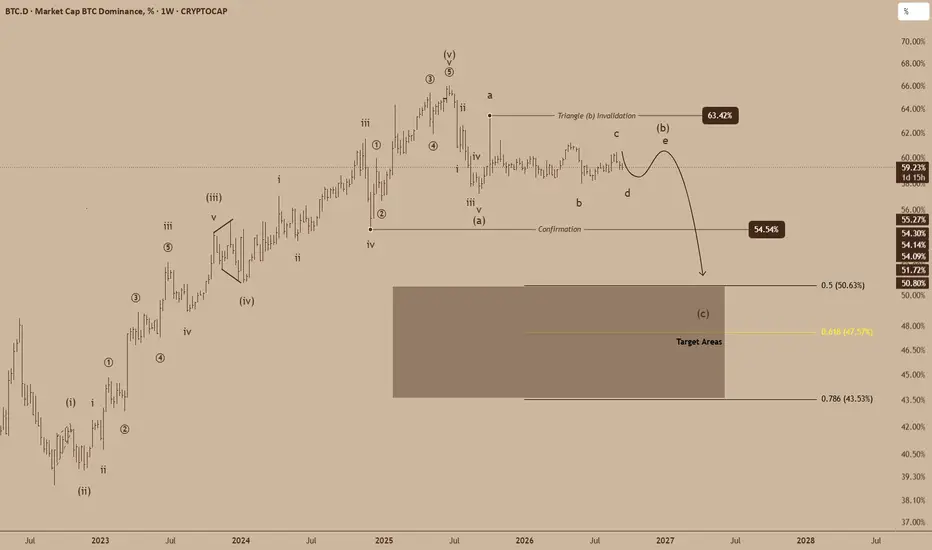
Bitcoin dominance is trading at 59.23% on the weekly chart, keeping BTC firmly in control of the crypto market. But the larger structure is becoming more interesting: dominance appears to be completing a corrective triangle before a potential larger decline.
The key question now is whether the current rebound is the final leg of that structure or the start of a broader continuation higher.
Fundamental / News Catalyst
There is no single catalyst clearly driving BTC dominance right now. The crypto market is being pulled in two directions.
Bitcoin recently rebounded above $80,000 despite the Federal Reserve raising rates by 25 bps to 3.75%–4.00% and the U.S. Senate rejecting the Clarity Act. Bitcoin ETF flows also turned positive on September 17 after two consecutive days of significant outflows.
At the same time, broader crypto market breadth improved sharply on September 18, with 89 of 100 tracked assets advancing while Bitcoin gained less than the broader basket.
That divergence matters for BTC dominance: Bitcoin remains strong, but capital participation outside BTC is beginning to broaden.
Technical Analysis
The weekly BTC.D structure shows a long corrective formation developing after the major 2025 peak.
The current price sits around 59.23%, close to the upper portion of the projected triangle structure. The chart labels the latest advance as a potential Wave (e), suggesting the triangle may be approaching completion.
The critical structural level is 63.42%.
A sustained move above 63.42% would invalidate the triangle interpretation shown on the chart and force a reassessment of the bearish dominance thesis.
On the downside, 54.54% is the key confirmation level. A decisive break below this area would provide confirmation that the projected decline is gaining traction.
From there, the chart identifies three major downside references:
50.63% — 0.5 retracement
47.50% — 0.618 retracement / primary target area
43.53% — 0.786 retracement
The highlighted zone between roughly 47.50% and 43.53% represents the main projected target region for Wave (c).
Key Levels:
63.42% - Triangle invalidation
59.23% - Current BTC dominance
54.54% - Confirmation
50.63% - First downside reference
47.50% - 0.618 target
43.53% - 0.786 target
Bullish Scenario
BTC dominance continues higher and breaks 63.42%. That would invalidate the triangle interpretation and indicate that the current structure needs to be reconsidered.
Bearish Scenario
Dominance fails to sustain the current rebound and breaks below 54.54%. That would confirm the downside structure and bring 50.63%, followed by the 47.50%–43.53% target zone, into focus.
Bitcoin dominance is trading at 59.23% on the weekly chart, keeping BTC firmly in control of the crypto market. But the larger structure is becoming more interesting: dominance appears to be completing a corrective triangle before a potential larger decline.
The key question now is whether the current rebound is the final leg of that structure or the start of a broader continuation higher.
Fundamental / News Catalyst
There is no single catalyst clearly driving BTC dominance right now. The crypto market is being pulled in two directions.
Bitcoin recently rebounded above $80,000 despite the Federal Reserve raising rates by 25 bps to 3.75%–4.00% and the U.S. Senate rejecting the Clarity Act. Bitcoin ETF flows also turned positive on September 17 after two consecutive days of significant outflows.
At the same time, broader crypto market breadth improved sharply on September 18, with 89 of 100 tracked assets advancing while Bitcoin gained less than the broader basket.
That divergence matters for BTC dominance: Bitcoin remains strong, but capital participation outside BTC is beginning to broaden.
Technical Analysis
The weekly BTC.D structure shows a long corrective formation developing after the major 2025 peak.
The current price sits around 59.23%, close to the upper portion of the projected triangle structure. The chart labels the latest advance as a potential Wave (e), suggesting the triangle may be approaching completion.
The critical structural level is 63.42%.
A sustained move above 63.42% would invalidate the triangle interpretation shown on the chart and force a reassessment of the bearish dominance thesis.
On the downside, 54.54% is the key confirmation level. A decisive break below this area would provide confirmation that the projected decline is gaining traction.
From there, the chart identifies three major downside references:
50.63% — 0.5 retracement
47.50% — 0.618 retracement / primary target area
43.53% — 0.786 retracement
The highlighted zone between roughly 47.50% and 43.53% represents the main projected target region for Wave (c).
Key Levels:
63.42% - Triangle invalidation
59.23% - Current BTC dominance
54.54% - Confirmation
50.63% - First downside reference
47.50% - 0.618 target
43.53% - 0.786 target
Bullish Scenario
BTC dominance continues higher and breaks 63.42%. That would invalidate the triangle interpretation and indicate that the current structure needs to be reconsidered.
Bearish Scenario
Dominance fails to sustain the current rebound and breaks below 54.54%. That would confirm the downside structure and bring 50.63%, followed by the 47.50%–43.53% target zone, into focus.

免责声明
这些信息和出版物并非旨在提供,也不构成TradingView提供或认可的任何形式的财务、投资、交易或其他类型的建议或推荐。请阅读使用条款了解更多信息。