
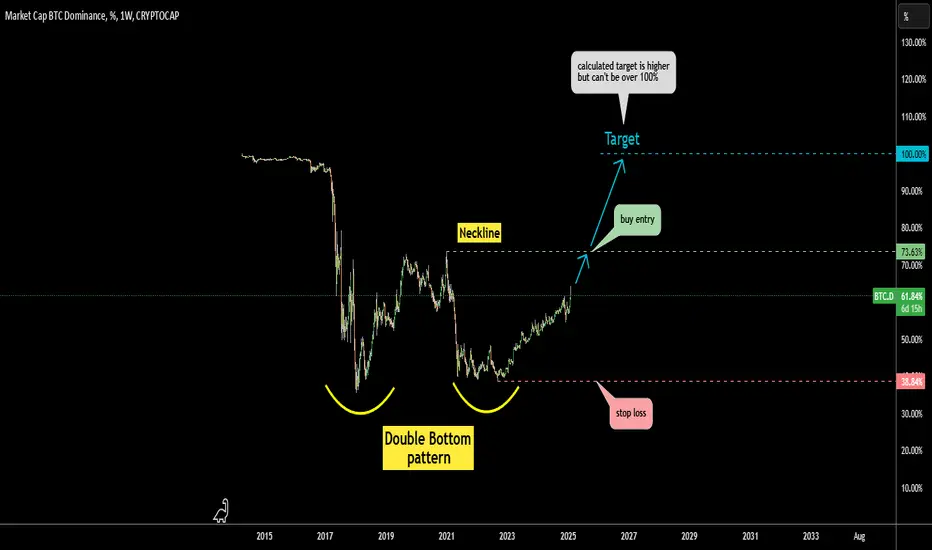
Last week my post on Bitcoin dominance played out faster than it was expected.
(see related)
This indicator broke out into 60-70% area.
So, I switched to a weekly time frame and spotted a classic reversal pattern called "Double Bottom" in the making for you.
Let's break it down.
We have two bottoms highlighted with yellow arcs in the same area.
Indicator eyes the middle top between bottoms, it is called "Neckline"
Now, let's breakdown buying technique:
1) buy entry is at the breakout above Neckline (green dashed line)
2) stop loss is at the valley of the right bottom (red dashed line)
3) target is located at the depth of the right bottom from the Neckline.
in our case it can't be higher than 100% and is set at the maximum (blue dashed line)
Its amazing that technical analysis could predict things that out of our scope as yet.
(see related)
This indicator broke out into 60-70% area.
So, I switched to a weekly time frame and spotted a classic reversal pattern called "Double Bottom" in the making for you.
Let's break it down.
We have two bottoms highlighted with yellow arcs in the same area.
Indicator eyes the middle top between bottoms, it is called "Neckline"
Now, let's breakdown buying technique:
1) buy entry is at the breakout above Neckline (green dashed line)
2) stop loss is at the valley of the right bottom (red dashed line)
3) target is located at the depth of the right bottom from the Neckline.
in our case it can't be higher than 100% and is set at the maximum (blue dashed line)
Its amazing that technical analysis could predict things that out of our scope as yet.

免责声明
这些信息和出版物并非旨在提供,也不构成TradingView提供或认可的任何形式的财务、投资、交易或其他类型的建议或推荐。请阅读使用条款了解更多信息。