做空
#BITCOIN - Still under #BearishZone
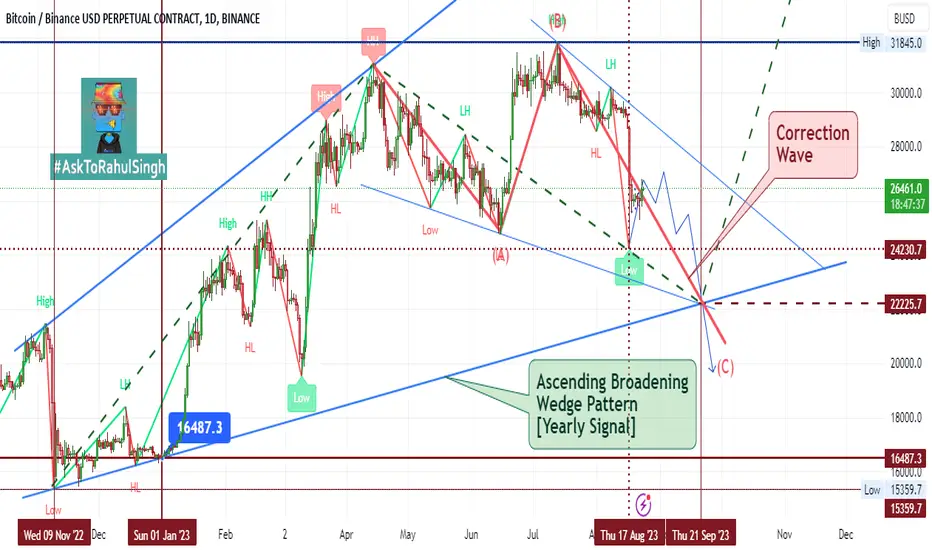
#BITCOIN 1-Day Chart Analysis
As per daily signals into yearly chart pattern, BTC moving under Ascending Broadening Wedge pattern from January 2023 to at present and still to be continue....
As per pattern, BTC moving into final downtrend cycle of #CorrectionWave and as per pattern, its final Lower-Low point will be approx. $22.225 and last lowest cut-off point will be $19.5k, if market goes more Bearish.
As per historic chart of last 11 years in Trading of BTC, September month was always under #BearishZone and their will be major chances for this year too,,,,
Lets, see...
What's the next market Sentiments...
Anyway,
Always Trade wisely by using #StopLoss and #DYOR, It's #NFA
&
Must FOLLOW, LIKE, SHARE & COMMENT on it...
As per daily signals into yearly chart pattern,
BTC moving under Ascending Broadening Wedge pattern from January 2023 to at present and still to be continue....As per pattern, BTC moving into final downtrend cycle of #CorrectionWave and as per pattern, its final Lower-Low point will be approx. $22.225 and last lowest cut-off point will be $19.5k, if market goes more Bearish.
As per historic chart of last 11 years in Trading of BTC, September month was always under #BearishZone and their will be major chances for this year too,,,,
Lets, see...
What's the next market Sentiments...
Anyway,
Always Trade wisely by using #StopLoss and #DYOR, It's #NFA
&
Must FOLLOW, LIKE, SHARE & COMMENT on it...

相关出版物
免责声明
这些信息和出版物并非旨在提供,也不构成TradingView提供或认可的任何形式的财务、投资、交易或其他类型的建议或推荐。请阅读使用条款了解更多信息。