
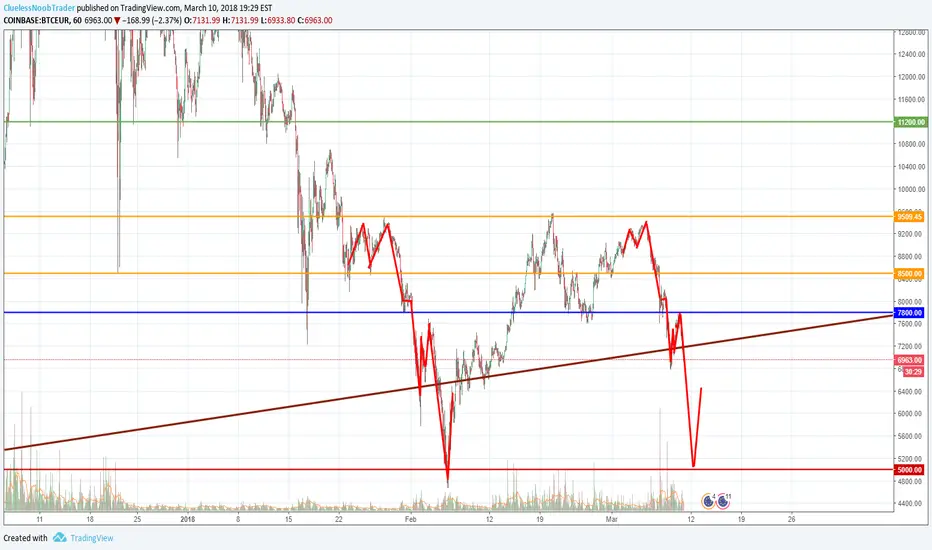
The overall trend on the 1 hour chart from 23rd January to 3rd February has apparently been repeating itself, albeit narrower horizontally, since 2nd March. Whether this is a statistical fluke, an inherent anomaly in the programming of the Matrix, or something else, if this trend holds to be true then we're looking at Bitcoin dipping below €6000 and possibly all the way back down to €5000.
Also of interest is the brown trendline, which is a continuation of the overall trend from April 2017 to October 2017, before the madness started in November. This represents where I think Bitcoin should be and will hover around for the foreseeable future, assuming that the new 2017 HODLers down freak out and short or that November 2017 bullish behaviour doesn't start up again..
Also of interest is the brown trendline, which is a continuation of the overall trend from April 2017 to October 2017, before the madness started in November. This represents where I think Bitcoin should be and will hover around for the foreseeable future, assuming that the new 2017 HODLers down freak out and short or that November 2017 bullish behaviour doesn't start up again..
注释
There's a small bounce on the HODLer trend line as previously. If I'm right, it should start dipping viciously over the next day.注释
注释
The HODLer trendline:
免责声明
这些信息和出版物并非旨在提供,也不构成TradingView提供或认可的任何形式的财务、投资、交易或其他类型的建议或推荐。请阅读使用条款了解更多信息。
免责声明
这些信息和出版物并非旨在提供,也不构成TradingView提供或认可的任何形式的财务、投资、交易或其他类型的建议或推荐。请阅读使用条款了解更多信息。