
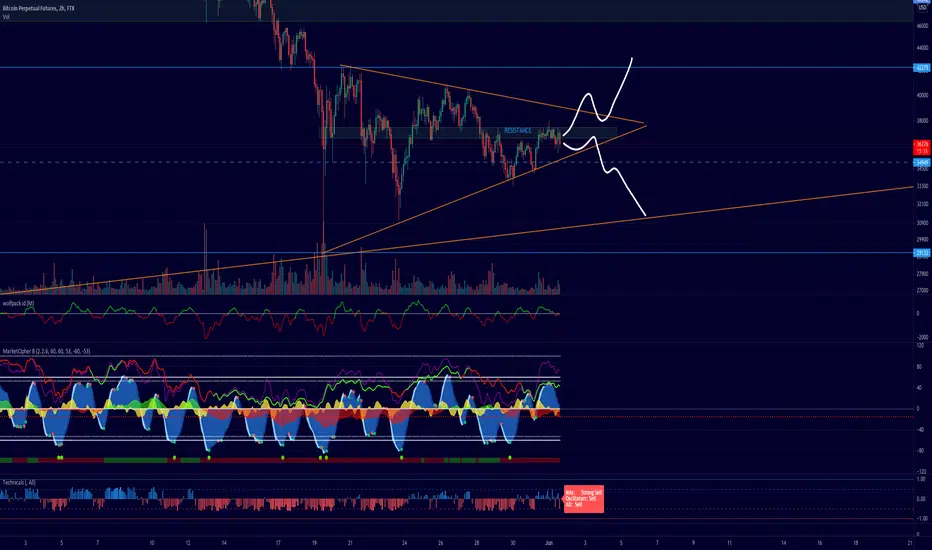
Formed a pennant, this is a typical continuation pattern. As we are in a downtrend we could see a further continuation of the downtrend to support around $29,000.
Buyer volume looks weak trading below resistance as highlighted. The seller waves look greater than the buyers in comparison and the price is now trading below the 21 moving average which is bearish until it breaks above.
If we can break above the resistance and out the pennant with a retest of the pennant then $42,000 would be resistance.
Technicals all indicator showing not many buyers present yet and strong seller waves with the money flow index still in the red with sellers in control.
Still taking time to develop, an important one to watch as the market will follow it.
Buyer volume looks weak trading below resistance as highlighted. The seller waves look greater than the buyers in comparison and the price is now trading below the 21 moving average which is bearish until it breaks above.
If we can break above the resistance and out the pennant with a retest of the pennant then $42,000 would be resistance.
Technicals all indicator showing not many buyers present yet and strong seller waves with the money flow index still in the red with sellers in control.
Still taking time to develop, an important one to watch as the market will follow it.

免责声明
这些信息和出版物并非旨在提供,也不构成TradingView提供或认可的任何形式的财务、投资、交易或其他类型的建议或推荐。请阅读使用条款了解更多信息。