
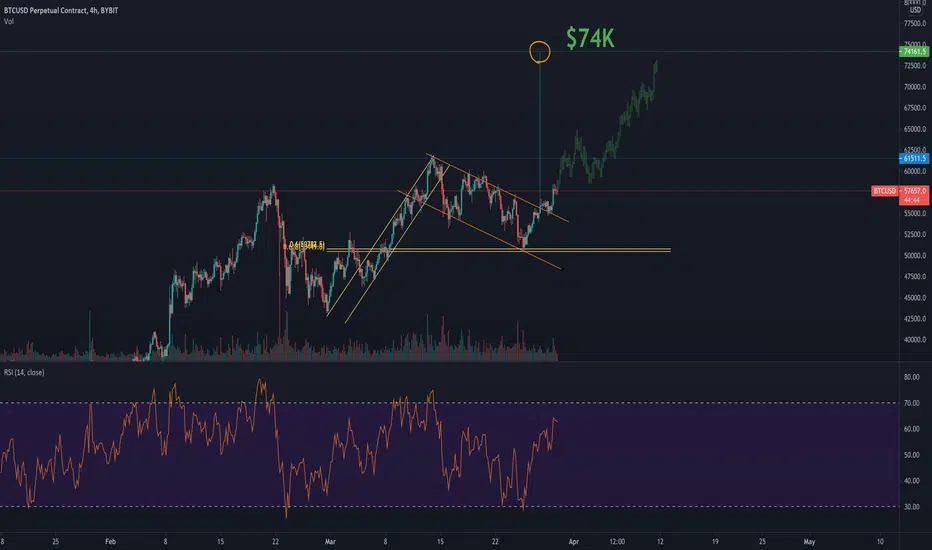
In the chart we can see a Bull Flag Formation that is created by 2 channels, we have some important support and resistance lines. Bitcoin broke the upper resistance line, it may be going to test the line as a support, but not very likely if we gain momentum in the next hours and days.
Target estimated by the projection of distance from the bottom of the pattern to the top gives uy $74K.
Time estimation is probably lead us to think that April will be the month (mid April) to reach the target. That's two weeks from now.
Lastly, we can also see that Fibonacci Golden Pocket played incredibly well at indicating key support level on $50-51K level
Target estimated by the projection of distance from the bottom of the pattern to the top gives uy $74K.
Time estimation is probably lead us to think that April will be the month (mid April) to reach the target. That's two weeks from now.
Lastly, we can also see that Fibonacci Golden Pocket played incredibly well at indicating key support level on $50-51K level

免责声明
这些信息和出版物并非旨在提供,也不构成TradingView提供或认可的任何形式的财务、投资、交易或其他类型的建议或推荐。请阅读使用条款了解更多信息。