
Hello ,
“Make it simple, make profit”
It’s BitcoinGuide.
Don’t forget to
“Follow” me and press “Likes”.
If you "follow" press,
Only 30 Min chart ,
In real time, you can check major sections and move,
Real-time "update I dea" can be checked.
I will begin BTCUSD Bybit Bitcoin Chart Analysis for August 27th .
This is a move after private comment 26th.
Like the first analysis, it was a one-way strategy.
After entering a short position at $48854,
it fell to the without a rebound.
The purple parallel line I marked -> After breaking through to the pink resistance line
As the wave subsided, the sideways trade ended.
Only short position counting is a total profit section of $2,609.
Congratulations to profit.
4 hour chart
I checked today's approximate Top/Bottom price.
Just in case, at the bottom
I left one major support line as a pattern.
About the orange resistance / light blue support line convergence.
It seems that today's direction will be decided.
Created today's trading strategy
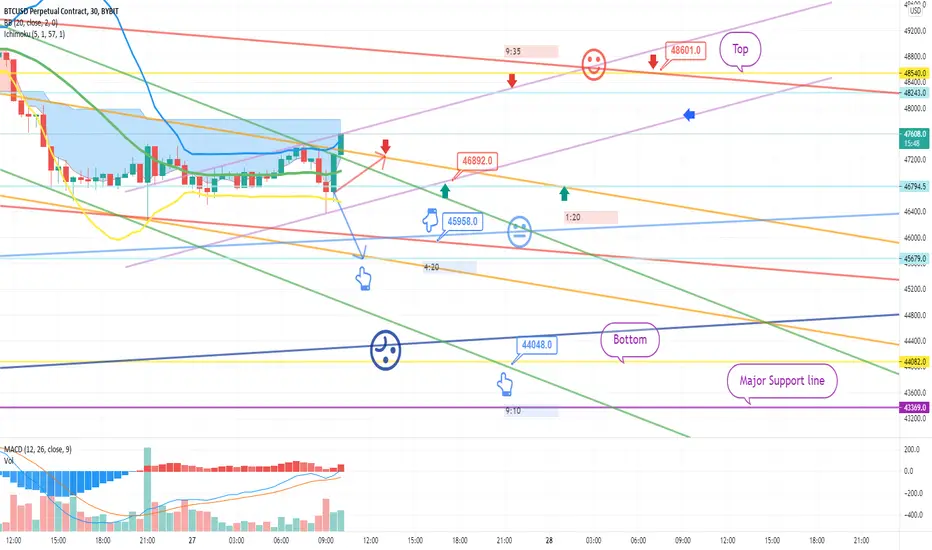
30 minute chart long position strategy
Generally, a decline occurs when it is expected to go higher.
When anyone looks like it's going down, there's a rebound.
This is my personal opinion, so please keep it in mind.
Top price / Bottom price has been modified according to the strategy
Create purple parallel lines (strong rise)
Key times are indicated.
* When the red arrow moves
long position strategy
It is a strategy to Upward move .
The current position looks good in the shape of the BB 1-hour chart support line.
After the BB 2 hour support level, it is trending downward.
46892 Long position entry section / Stop loss when breaking the purple support line
It is the first target in the purple resistance line at the top.
I think you can cut it off once in a while.
If you can afford it, short position.
This is the final long position switching, but this section is a bit vague.
The purple support line is likely to break
You will see the price on the right.
Check until the sky blue support line is broken
The final target will be the Top price.
* When the light blue finger moves
Short -> Long Switching Strategy
The current location is open at the bottom
This is an area where the decline can accelerate.
$45958 short position entry section / Stop loss when the green resistance line is broken
(The orange parallel line is a right-down sideways trend)
Final $44048 long position switching section / Stop loss when breaking the green support line
Below is the purple major support line.
Maybe they're making fun of you and thinking that you won't be able to touch this section.
If you touch this section, you will get a rebound.
If it fails, an additional drop may occur in the creation of additional bars after tomorrow.
Don't forget to buy in principle / stop loss is essential
Have a good weekend
thank you
交易结束:到达目标
Private comments.
$2219 profit segment.
thank you.

[Bitcoin Guide Affiliate]
*Bybit 20%DC Lifetime + $30,100
partner.bybit.com/b/Bitcoin_Guide
*BingX 50%DC + $14,100
bit.ly/3E8ZkAW
*ZeroMarket ECN 40%DC
bit.ly/3pY0dUv
*Telegram
t.me/bitcoinguide_TM
*Bybit 20%DC Lifetime + $30,100
partner.bybit.com/b/Bitcoin_Guide
*BingX 50%DC + $14,100
bit.ly/3E8ZkAW
*ZeroMarket ECN 40%DC
bit.ly/3pY0dUv
*Telegram
t.me/bitcoinguide_TM
相关出版物
免责声明
这些信息和出版物并非旨在提供,也不构成TradingView提供或认可的任何形式的财务、投资、交易或其他类型的建议或推荐。请阅读使用条款了解更多信息。
[Bitcoin Guide Affiliate]
*Bybit 20%DC Lifetime + $30,100
partner.bybit.com/b/Bitcoin_Guide
*BingX 50%DC + $14,100
bit.ly/3E8ZkAW
*ZeroMarket ECN 40%DC
bit.ly/3pY0dUv
*Telegram
t.me/bitcoinguide_TM
*Bybit 20%DC Lifetime + $30,100
partner.bybit.com/b/Bitcoin_Guide
*BingX 50%DC + $14,100
bit.ly/3E8ZkAW
*ZeroMarket ECN 40%DC
bit.ly/3pY0dUv
*Telegram
t.me/bitcoinguide_TM
相关出版物
免责声明
这些信息和出版物并非旨在提供,也不构成TradingView提供或认可的任何形式的财务、投资、交易或其他类型的建议或推荐。请阅读使用条款了解更多信息。