
1. Key Components on the Chart
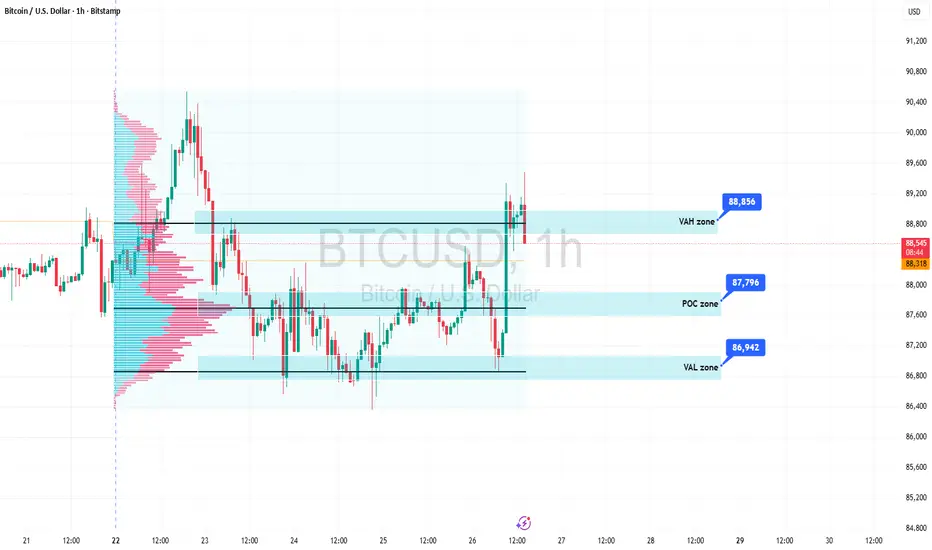
The chart highlights three critical price levels based on historical trading volume:
VAH (Value Area High - 88,856): The upper boundary of the value area. This acts as a resistance zone where sellers have historically stepped in.
POC (Point of Control - 87,796): Represented by the central line. This is the price level with the highest trading volume, acting like a "magnet" that attracts price action.
VAL (Value Area Low - 86,942): The lower boundary of the value area. This usually serves as a strong support zone where buyers find value.
2. Current Price Action
Breakout Attempt: The price recently made a strong push from the POC zone toward the VAH (88,856). Currently, the price is hovering right at this boundary.
Short-term Trend: Since the price is trading in the upper half of the value area, the short-term sentiment is bullish. However, maintaining a position above 88,856 is crucial for further upside.
3. Potential Scenarios
Scenario 1: Bullish Continuation
If BTC closes firmly above 88,856 and successfully retests this zone as support, the next targets would be the previous local highs around 90,000 - 91,200. In this case, VAH flips from resistance to support.
Scenario 2: Mean Reversion (Correction to POC)
If the price fails to hold above 88,856 and drops back into the "Value Area," it is highly likely to gravitate back toward the POC (87,796). This is a natural correction to find "fair value" based on volume.
Scenario 3: Bearish Drop
If selling pressure increases and the price breaks below the POC, the final support level in this structure is the VAL (86,942). This would be considered a "discount" zone for swing traders.
4. Key Takeaways
The Critical Level: 88,856. Watch the 1h candle close relative to this line.
Volatility Note: There are some "low volume nodes" (gaps in the volume bars) between the POC and VAH, which means the price can move very quickly (and sometimes unpredictably) through these zones.
The chart highlights three critical price levels based on historical trading volume:
VAH (Value Area High - 88,856): The upper boundary of the value area. This acts as a resistance zone where sellers have historically stepped in.
POC (Point of Control - 87,796): Represented by the central line. This is the price level with the highest trading volume, acting like a "magnet" that attracts price action.
VAL (Value Area Low - 86,942): The lower boundary of the value area. This usually serves as a strong support zone where buyers find value.
2. Current Price Action
Breakout Attempt: The price recently made a strong push from the POC zone toward the VAH (88,856). Currently, the price is hovering right at this boundary.
Short-term Trend: Since the price is trading in the upper half of the value area, the short-term sentiment is bullish. However, maintaining a position above 88,856 is crucial for further upside.
3. Potential Scenarios
Scenario 1: Bullish Continuation
If BTC closes firmly above 88,856 and successfully retests this zone as support, the next targets would be the previous local highs around 90,000 - 91,200. In this case, VAH flips from resistance to support.
Scenario 2: Mean Reversion (Correction to POC)
If the price fails to hold above 88,856 and drops back into the "Value Area," it is highly likely to gravitate back toward the POC (87,796). This is a natural correction to find "fair value" based on volume.
Scenario 3: Bearish Drop
If selling pressure increases and the price breaks below the POC, the final support level in this structure is the VAL (86,942). This would be considered a "discount" zone for swing traders.
4. Key Takeaways
The Critical Level: 88,856. Watch the 1h candle close relative to this line.
Volatility Note: There are some "low volume nodes" (gaps in the volume bars) between the POC and VAH, which means the price can move very quickly (and sometimes unpredictably) through these zones.

相关出版物
免责声明
这些信息和出版物并非旨在提供,也不构成TradingView提供或认可的任何形式的财务、投资、交易或其他类型的建议或推荐。请阅读使用条款了解更多信息。