
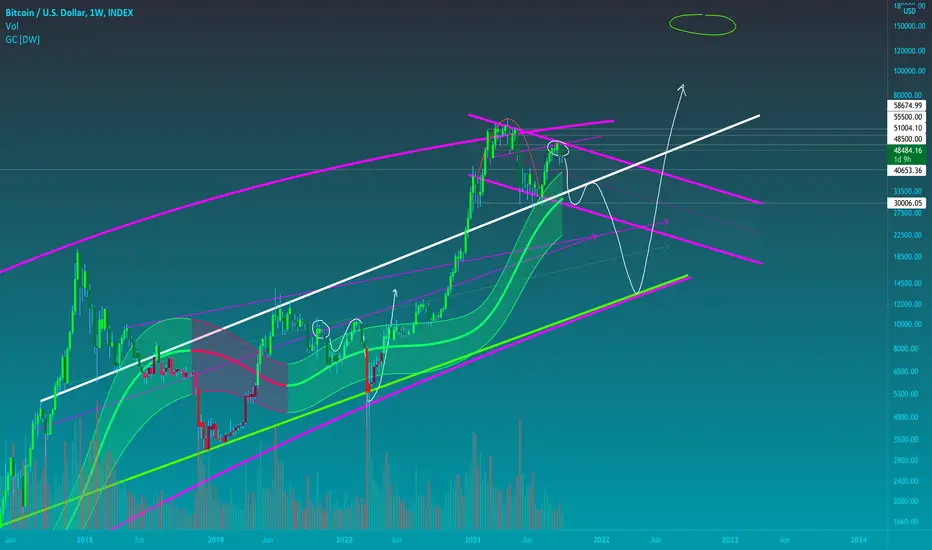
Using the channel indicator on a logarithmic scale, you can see strong similarity of our current bull run vs 2019 bull run.
After first large dump, market bounces off top of channel and uses it as support.
Following this, it bounces off the 50% line within the channel and heads to a strong resistance on a trend line (white one)
We then see a dump through the bottom of the channel which then lands on a strong logarithmic curve line(thick purple) and a logarithmic trend line(thick green)
After this, the bottom is set and a new bull run can commence. Target at 100k plus.
After first large dump, market bounces off top of channel and uses it as support.
Following this, it bounces off the 50% line within the channel and heads to a strong resistance on a trend line (white one)
We then see a dump through the bottom of the channel which then lands on a strong logarithmic curve line(thick purple) and a logarithmic trend line(thick green)
After this, the bottom is set and a new bull run can commence. Target at 100k plus.

免责声明
这些信息和出版物并非旨在提供,也不构成TradingView提供或认可的任何形式的财务、投资、交易或其他类型的建议或推荐。请阅读使用条款了解更多信息。
免责声明
这些信息和出版物并非旨在提供,也不构成TradingView提供或认可的任何形式的财务、投资、交易或其他类型的建议或推荐。请阅读使用条款了解更多信息。