
Understanding Volume-Based Market Structure
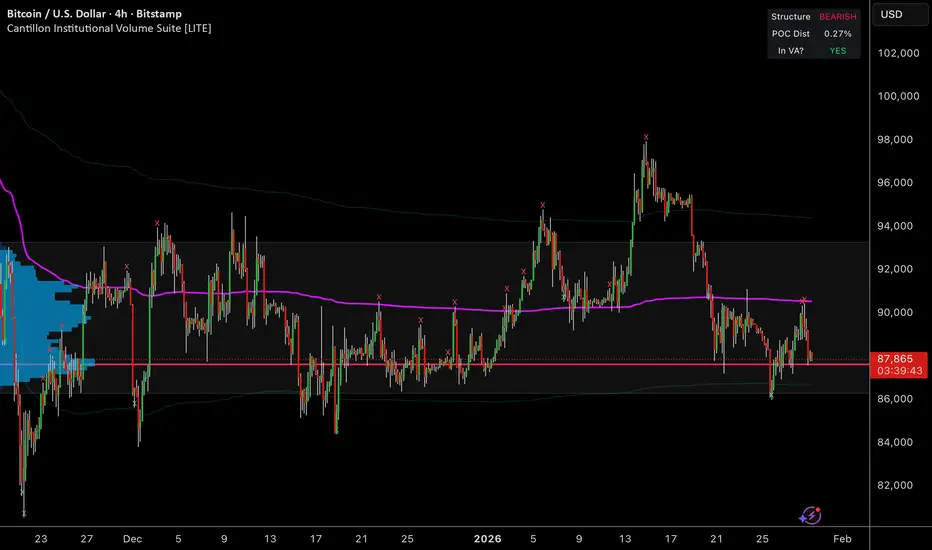
This analysis examines Bitcoin through the lens of institutional volume flow, anchored VWAP positioning, and volume profile theory. The goal is to demonstrate how professional traders identify regime changes and manage risk using volume-based methodologies.
Current Market Structure: Bearish AVWAP Regime
Key Metrics:
Structure: BEARISH
VWAP Distance: -2.65%
POC Distance: +0.7%
Price: $88,240
What Does "Bearish Regime" Mean?
In volume-based trading, we classify market regimes by price relationship to anchored VWAP (Volume Weighted Average Price). When price trades below VWAP, institutional positioning favors distribution over accumulation. This doesn't predict direction—it describes the current structural bias.
Educational Principle: AVWAP acts as a dynamic fair value reference. Price above VWAP suggests institutional sponsorship (accumulation regime). Price below VWAP indicates institutional distribution or profit-taking.
Volume Profile Analysis: Understanding Institutional Positioning
The volume profile histogram (left side of chart) reveals where significant volume transacted historically:
High Volume Nodes (HVN)
90,000 level: Major volume concentration (olive/brown zone)
87,000-88,000: Current consolidation building volume
High volume nodes represent equilibrium zones where buyers and sellers reached extended agreement. These levels act as magnets for price—we often see price return to test these zones after trending moves.
Low Volume Nodes (LVN)
93,000-96,000: Minimal volume overhead
85,000-86,000: Volume gap below
Low volume areas create rapid price movement when tested, as there's minimal interest to slow momentum. These become measured move targets.
Point of Control (POC) Analysis
Current POC: ~88,600 (marked by white horizontal line through volume profile)
The Point of Control represents the price level with the highest volume during the measurement period. Currently, price is trading just below POC, which has important structural implications:
When price trades at or near POC while in a bearish AVWAP regime, we're in a decision zone. This represents the "fairest" price based on historical volume—neither extended nor oversold. Direction from here depends on whether accumulation or distribution dominates.
Bitcoin currently exhibits bearish regime characteristics with emerging divergence signals. The prudent approach involves:
Patience: Wait for regime confirmation before directional commitment
Preparation: Identify key levels where probability shifts (90,500 upside, 86,500 downside)
Process: Follow volume structure regardless of bias or hope
The market will resolve this structure—our job is to recognize the resolution when it occurs, not predict it in advance.
This analysis examines Bitcoin through the lens of institutional volume flow, anchored VWAP positioning, and volume profile theory. The goal is to demonstrate how professional traders identify regime changes and manage risk using volume-based methodologies.
Current Market Structure: Bearish AVWAP Regime
Key Metrics:
Structure: BEARISH
VWAP Distance: -2.65%
POC Distance: +0.7%
Price: $88,240
What Does "Bearish Regime" Mean?
In volume-based trading, we classify market regimes by price relationship to anchored VWAP (Volume Weighted Average Price). When price trades below VWAP, institutional positioning favors distribution over accumulation. This doesn't predict direction—it describes the current structural bias.
Educational Principle: AVWAP acts as a dynamic fair value reference. Price above VWAP suggests institutional sponsorship (accumulation regime). Price below VWAP indicates institutional distribution or profit-taking.
Volume Profile Analysis: Understanding Institutional Positioning
The volume profile histogram (left side of chart) reveals where significant volume transacted historically:
High Volume Nodes (HVN)
90,000 level: Major volume concentration (olive/brown zone)
87,000-88,000: Current consolidation building volume
High volume nodes represent equilibrium zones where buyers and sellers reached extended agreement. These levels act as magnets for price—we often see price return to test these zones after trending moves.
Low Volume Nodes (LVN)
93,000-96,000: Minimal volume overhead
85,000-86,000: Volume gap below
Low volume areas create rapid price movement when tested, as there's minimal interest to slow momentum. These become measured move targets.
Point of Control (POC) Analysis
Current POC: ~88,600 (marked by white horizontal line through volume profile)
The Point of Control represents the price level with the highest volume during the measurement period. Currently, price is trading just below POC, which has important structural implications:
When price trades at or near POC while in a bearish AVWAP regime, we're in a decision zone. This represents the "fairest" price based on historical volume—neither extended nor oversold. Direction from here depends on whether accumulation or distribution dominates.
Bitcoin currently exhibits bearish regime characteristics with emerging divergence signals. The prudent approach involves:
Patience: Wait for regime confirmation before directional commitment
Preparation: Identify key levels where probability shifts (90,500 upside, 86,500 downside)
Process: Follow volume structure regardless of bias or hope
The market will resolve this structure—our job is to recognize the resolution when it occurs, not predict it in advance.

Daily top picks analysis → free & paid tiers
Custom Institutional volume terminal included with paid sub
thecantillonreport.substack.com/?utm_source=tradingview
cantillonresearch.com/
youtube.com/@cantillonresearch
Custom Institutional volume terminal included with paid sub
thecantillonreport.substack.com/?utm_source=tradingview
cantillonresearch.com/
youtube.com/@cantillonresearch
免责声明
这些信息和出版物并非旨在提供,也不构成TradingView提供或认可的任何形式的财务、投资、交易或其他类型的建议或推荐。请阅读使用条款了解更多信息。
Daily top picks analysis → free & paid tiers
Custom Institutional volume terminal included with paid sub
thecantillonreport.substack.com/?utm_source=tradingview
cantillonresearch.com/
youtube.com/@cantillonresearch
Custom Institutional volume terminal included with paid sub
thecantillonreport.substack.com/?utm_source=tradingview
cantillonresearch.com/
youtube.com/@cantillonresearch
免责声明
这些信息和出版物并非旨在提供,也不构成TradingView提供或认可的任何形式的财务、投资、交易或其他类型的建议或推荐。请阅读使用条款了解更多信息。