
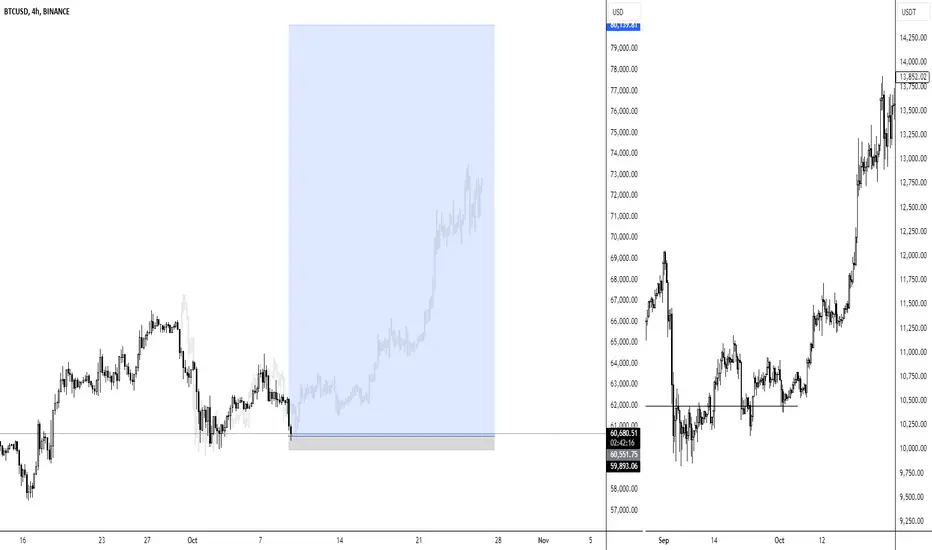
The chart right presents the pre bullmarket btc chart in 2020.
Strategy:
Potential long setup from the consolidation zone. The price action indicates a demand zone around the current levels, with a potential for reversal towards higher levels, as shown in the shaded blue area. The right-hand chart supports this bullish bias.
Entry: Around the current price levels (consolidation)
Stop-loss: Below the local support (recent swing low)
Risk management is essential, considering the current volatility and broader market correlation.
Strategy:
Potential long setup from the consolidation zone. The price action indicates a demand zone around the current levels, with a potential for reversal towards higher levels, as shown in the shaded blue area. The right-hand chart supports this bullish bias.
Entry: Around the current price levels (consolidation)
Stop-loss: Below the local support (recent swing low)
Risk management is essential, considering the current volatility and broader market correlation.
注释
Wait for CPI to put a trade on, today. Don't take the trade blindly as it is not active yet.
💎💎- Professional Trader
💎💎 - Discord: discord.gg/gHKNVMyEvd
💎💎 - Trading Course: liquiditysweep369.carrd.co/
💎💎 - Discord: discord.gg/gHKNVMyEvd
💎💎 - Trading Course: liquiditysweep369.carrd.co/
免责声明
这些信息和出版物并非旨在提供,也不构成TradingView提供或认可的任何形式的财务、投资、交易或其他类型的建议或推荐。请阅读使用条款了解更多信息。
💎💎- Professional Trader
💎💎 - Discord: discord.gg/gHKNVMyEvd
💎💎 - Trading Course: liquiditysweep369.carrd.co/
💎💎 - Discord: discord.gg/gHKNVMyEvd
💎💎 - Trading Course: liquiditysweep369.carrd.co/
免责声明
这些信息和出版物并非旨在提供,也不构成TradingView提供或认可的任何形式的财务、投资、交易或其他类型的建议或推荐。请阅读使用条款了解更多信息。