
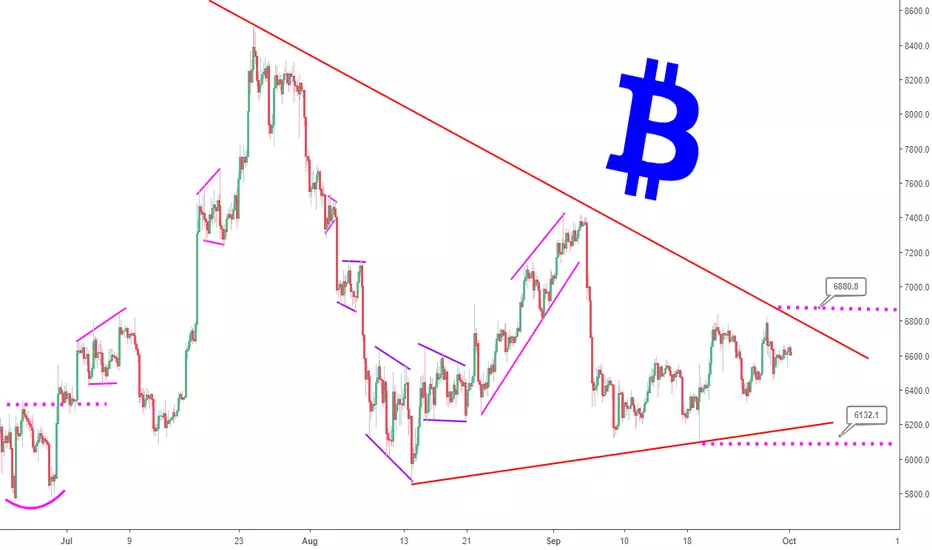
The 4 hour timeframe of Bitcoin is displayed in this analysis with price action from June 24, 2018 to current date. The overall sideways price action is captured with a symmetrical triangle chart pattern.
The implication of the chart pattern above is a balance between supply and demand for Bitcoin. ~$6,880.80 and $6,132.10 mark price levels that indicate possible exits from the chart pattern with the former indicating resumption of bullish momentum, and the latter bearish.
Width of the triangle is highly valuable in projection of price after a successful exit from the triangle.
The implication of the chart pattern above is a balance between supply and demand for Bitcoin. ~$6,880.80 and $6,132.10 mark price levels that indicate possible exits from the chart pattern with the former indicating resumption of bullish momentum, and the latter bearish.
Width of the triangle is highly valuable in projection of price after a successful exit from the triangle.

相关出版物
免责声明
这些信息和出版物并非旨在提供,也不构成TradingView提供或认可的任何形式的财务、投资、交易或其他类型的建议或推荐。请阅读使用条款了解更多信息。