
Hello, welcome to this BTC/USDT update by CRYPTO SANDERS.
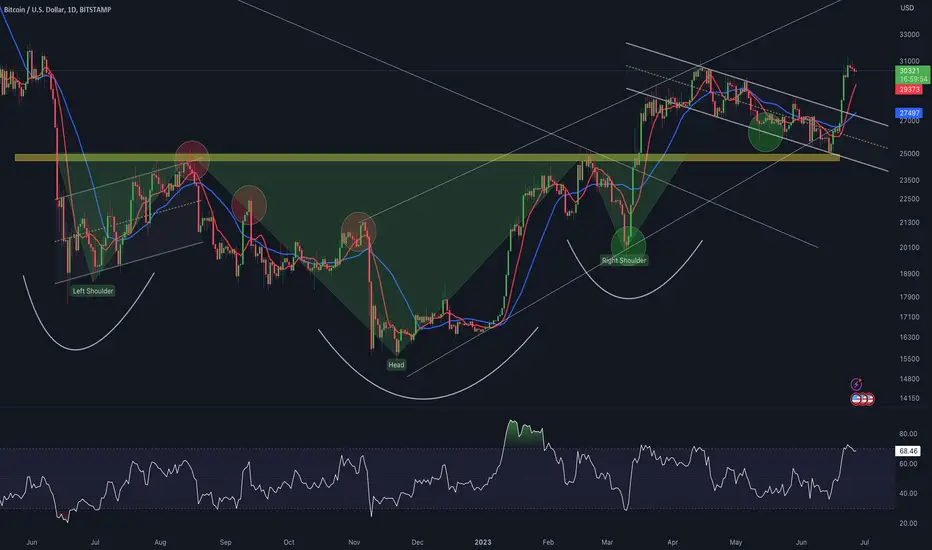
CHART ANALYSIS:- Bitcoin (BTC) moved marginally lower to start the week, as its price fell below the 31,000 mark on Monday.
BTC/USD dropped to an intraday low of 30,042.38 earlier in the day, which comes after the price peaked above 31,000 on Sunday.
Today’s slippage sees bitcoin decline for a third straight day and comes as the relative strength index (RSI) moved into overbought territory.
hit a peak of 72.92, which was not only near a ceiling of 73.00 but also its highest point since late January.
This reading prompted bears to enter the market again, pushing the RSI down to a current reading of 68.81.
68.00, and if this support point is broken, there is a good chance that BTC slips below 30,000.
I have tried to bring the best possible outcome to this chart.
Hit the like button if you like it and share your charts in the comments section.
Thank you
CHART ANALYSIS:- Bitcoin (BTC) moved marginally lower to start the week, as its price fell below the 31,000 mark on Monday.
BTC/USD dropped to an intraday low of 30,042.38 earlier in the day, which comes after the price peaked above 31,000 on Sunday.
Today’s slippage sees bitcoin decline for a third straight day and comes as the relative strength index (RSI) moved into overbought territory.
hit a peak of 72.92, which was not only near a ceiling of 73.00 but also its highest point since late January.
This reading prompted bears to enter the market again, pushing the RSI down to a current reading of 68.81.
68.00, and if this support point is broken, there is a good chance that BTC slips below 30,000.
I have tried to bring the best possible outcome to this chart.
Hit the like button if you like it and share your charts in the comments section.
Thank you

相关出版物
免责声明
这些信息和出版物并非旨在提供,也不构成TradingView提供或认可的任何形式的财务、投资、交易或其他类型的建议或推荐。请阅读使用条款了解更多信息。