
Morning guys,
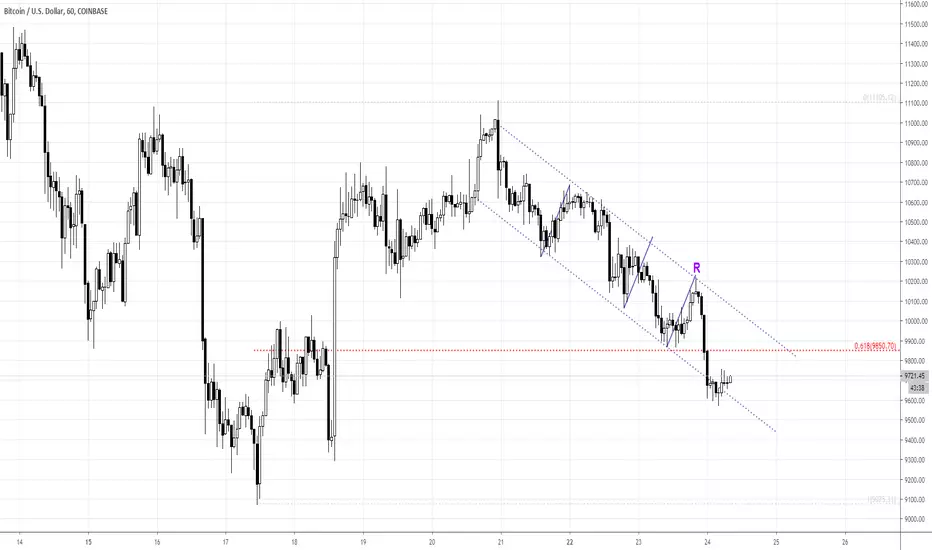
So, yesterday it was a bit dramatic action around our culmination area - bottom of right arm. As you know, that was not due some market factors but external intruding. D. Trump and Congress adopt new debt ceil for US national Debt, which was increased and should be sufficient for ~2 years. That was positive factor that supported USD. Thus, BTC/USD has shown the same reaction.
As a result we have following things. Market stands not too far from the perfect point of right arm's bottom and recent drop was mostly due external factors. But... we have bearish reversal candle on 4H chart,
on 1H chart we have just ordinary harmonic swing reaction to the point where major reversal had to happen. Drop down stands with acceleration (and 3 black crows, right?).
Thus, overall siuation now stands not as friendly as it was yesterday. If you already have longs, you could try to close it with minor upside pullack to entry level @9850 (or keep them if you have different view on situation).
Bears could step in soon, if BTC will continue dropping. If you do not have long position - wait for upside breakout on 1H channel and action above 10K area. All these scenarios are still possible as BTC has not leaved yet equilibrium area, but probabilities stand a bit different with a bit more in favor of downside continuation.

ForexPeaceArmy BTC analytics :
forexpeacearmy.com/r/author/11/sive-morten-blog
FX, GOLD:
forexpeacearmy.com/community/forums/sive-morten-currencies-and-gold-video-analysis.122/
forexpeacearmy.com/r/author/11/sive-morten-blog
FX, GOLD:
forexpeacearmy.com/community/forums/sive-morten-currencies-and-gold-video-analysis.122/
免责声明
这些信息和出版物并非旨在提供,也不构成TradingView提供或认可的任何形式的财务、投资、交易或其他类型的建议或推荐。请阅读使用条款了解更多信息。