
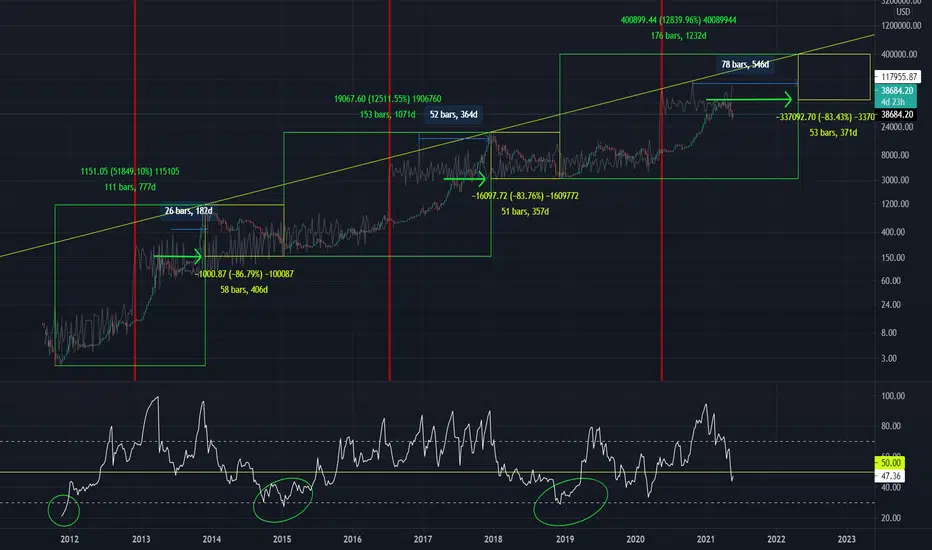
S2F model shows bitcoin is still on track.
Also, we see that this cycle has repeated after each halving (red lines).
At each mid cycle top (there has now been three) we see that it also represents the next cycle low.
Another thing to note are the peaks in the S2F model AFTER each halving; they show where the price will reach BEFORE the Blow-Off-Top
Act Accordingly
Also, we see that this cycle has repeated after each halving (red lines).
At each mid cycle top (there has now been three) we see that it also represents the next cycle low.
Another thing to note are the peaks in the S2F model AFTER each halving; they show where the price will reach BEFORE the Blow-Off-Top
Act Accordingly
注释
This guy stole my idea. youtube.com/watch?v=PR6QJV4taJU

免责声明
这些信息和出版物并非旨在提供,也不构成TradingView提供或认可的任何形式的财务、投资、交易或其他类型的建议或推荐。请阅读使用条款了解更多信息。
免责声明
这些信息和出版物并非旨在提供,也不构成TradingView提供或认可的任何形式的财务、投资、交易或其他类型的建议或推荐。请阅读使用条款了解更多信息。