
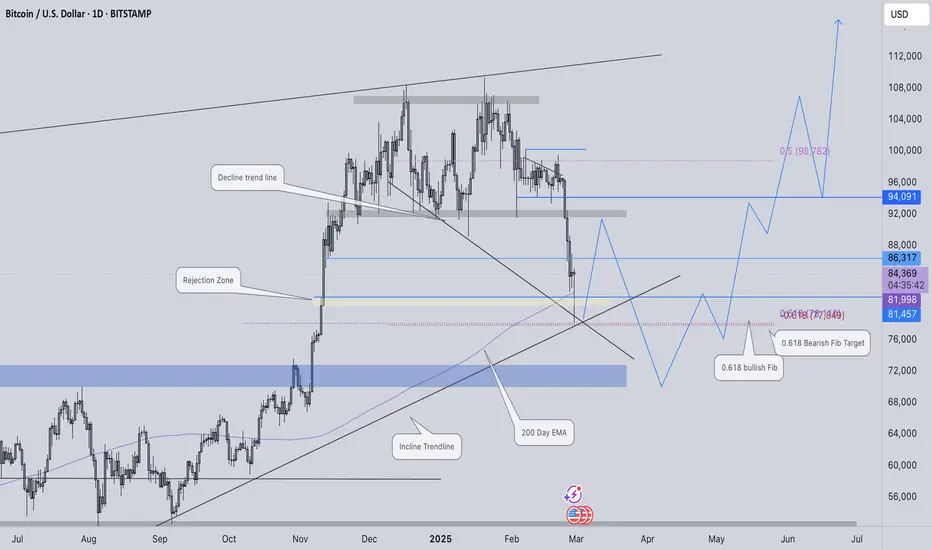
Over the past seven days, Bitcoin experienced a significant decline, dropping 2,440 pips before finding support around the 78,261 level. This area acted as a key zone of interest due to multiple technical confluences aligning, ultimately halting further downside movement. As a result, we are now witnessing a reaction at this level.
Looking ahead, I anticipate two potential scenarios. Bitcoin could revisit this support level, forming a double-bottom structure before initiating an upward push toward 91,500. Alternatively, it may first rally toward 91,500 before facing a rejection, leading to a corrective move down to approximately 71,500. If this pullback materializes and establishes a strong base, I expect Bitcoin to gain bullish momentum, eventually setting a new all-time high in the coming months.
Daily Chart Total Crypto Cap
There were multiple confluences to see an reaction at 2.6T.

Looking ahead, I anticipate two potential scenarios. Bitcoin could revisit this support level, forming a double-bottom structure before initiating an upward push toward 91,500. Alternatively, it may first rally toward 91,500 before facing a rejection, leading to a corrective move down to approximately 71,500. If this pullback materializes and establishes a strong base, I expect Bitcoin to gain bullish momentum, eventually setting a new all-time high in the coming months.
Daily Chart Total Crypto Cap
There were multiple confluences to see an reaction at 2.6T.

免责声明
这些信息和出版物并非旨在提供,也不构成TradingView提供或认可的任何形式的财务、投资、交易或其他类型的建议或推荐。请阅读使用条款了解更多信息。
免责声明
这些信息和出版物并非旨在提供,也不构成TradingView提供或认可的任何形式的财务、投资、交易或其他类型的建议或推荐。请阅读使用条款了解更多信息。