
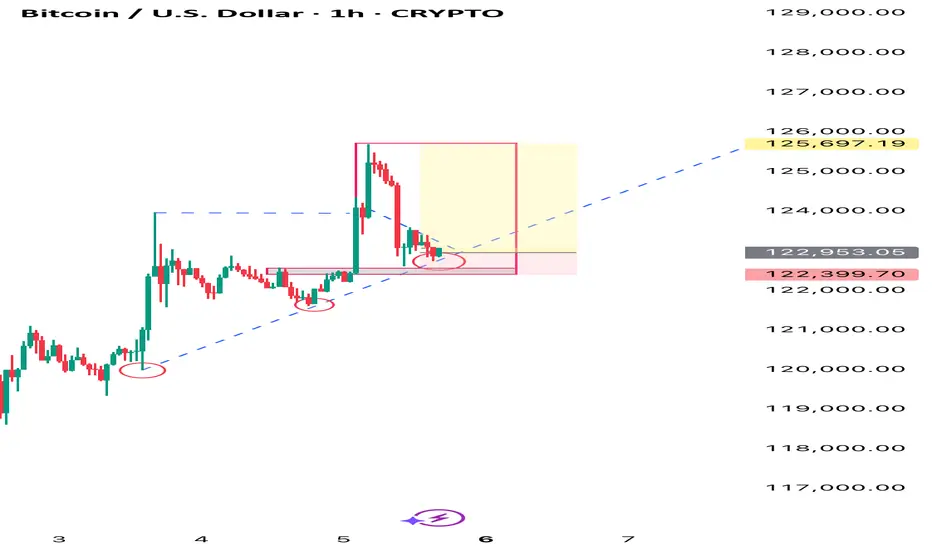
Bitcoin is respecting its bullish market structure, continuing to form higher highs and higher lows. After the impulsive rally toward 125,600, price has entered a short consolidation phase and is currently testing a rising trendline acting as dynamic support.
This structure resembles a bullish flag / ascending triangle, suggesting that buyers may soon regain control if price holds above the trendline.
🔹 Market Outlook
• Structure: Bullish continuation
• Pattern: Bullish flag / triangle formation
• Bias: Buy on confirmation above resistance or from trendline support
💎 Trade Plan
Option 1 – Immediate Buy (Aggressive)
🟢 Buy Now: 122,900 – 123,000
🎯 Target 1: 123,800
🎯 Target 2: 125,500 (resistance high)
🛑 Stop-Loss: below 122,400
Option 2 – Pending Buy (Conservative)
🟢 Buy Stop: 123,600 (breakout above flag)
🎯 Target 1: 124,600
🎯 Target 2: 125,500 – 126,000
🛑 Stop-Loss: below 122,800
⚠️ Alternative Scenario
If the trendline breaks and price closes below 122,400, expect a short-term shift toward 121,800–121,200, where fresh demand could appear for the next leg higher.
📈 Summary
• Trendline support still intact ✅
• Bullish flag structure forming ✅
• Confirmation needed above 123,600 for momentum continuation 🚀
• Maintain bullish bias while price holds above 122,400
This structure resembles a bullish flag / ascending triangle, suggesting that buyers may soon regain control if price holds above the trendline.
🔹 Market Outlook
• Structure: Bullish continuation
• Pattern: Bullish flag / triangle formation
• Bias: Buy on confirmation above resistance or from trendline support
💎 Trade Plan
Option 1 – Immediate Buy (Aggressive)
🟢 Buy Now: 122,900 – 123,000
🎯 Target 1: 123,800
🎯 Target 2: 125,500 (resistance high)
🛑 Stop-Loss: below 122,400
Option 2 – Pending Buy (Conservative)
🟢 Buy Stop: 123,600 (breakout above flag)
🎯 Target 1: 124,600
🎯 Target 2: 125,500 – 126,000
🛑 Stop-Loss: below 122,800
⚠️ Alternative Scenario
If the trendline breaks and price closes below 122,400, expect a short-term shift toward 121,800–121,200, where fresh demand could appear for the next leg higher.
📈 Summary
• Trendline support still intact ✅
• Bullish flag structure forming ✅
• Confirmation needed above 123,600 for momentum continuation 🚀
• Maintain bullish bias while price holds above 122,400
交易结束:到达目标
Target 2 Hit 
免责声明
这些信息和出版物并非旨在提供,也不构成TradingView提供或认可的任何形式的财务、投资、交易或其他类型的建议或推荐。请阅读使用条款了解更多信息。