
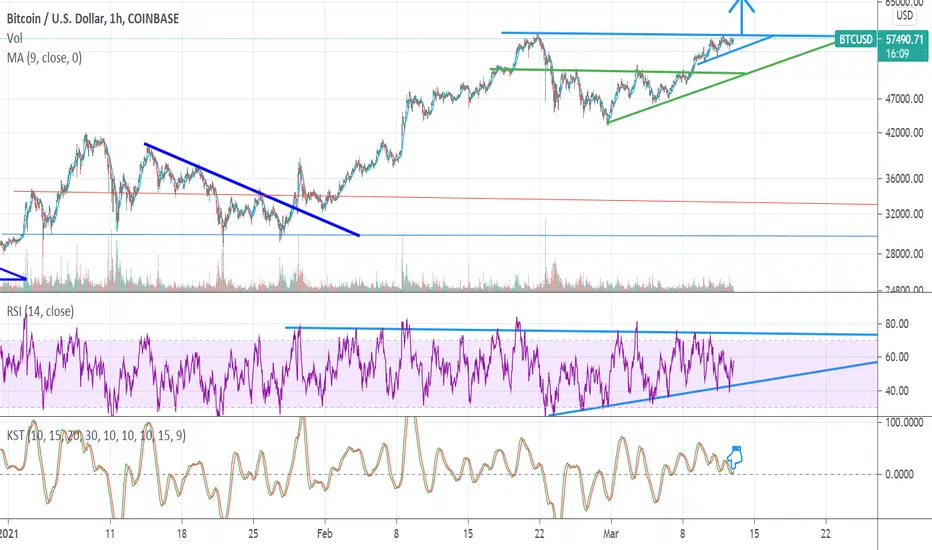
It appears as though Bitcoin is forming a micro ascending triangle after recently breaking out to the upside of a similar pattern in green.
On the RSI there's a series of higher lows forming an ascending triangle, but the previous two lows are right on the upward sloping support of the pattern and are close to being considered lower lows.
On the KST there is a bullish cross where I've placed the blue downward-sloping finger.
On the RSI there's a series of higher lows forming an ascending triangle, but the previous two lows are right on the upward sloping support of the pattern and are close to being considered lower lows.
On the KST there is a bullish cross where I've placed the blue downward-sloping finger.

免责声明
这些信息和出版物并非旨在提供,也不构成TradingView提供或认可的任何形式的财务、投资、交易或其他类型的建议或推荐。请阅读使用条款了解更多信息。