
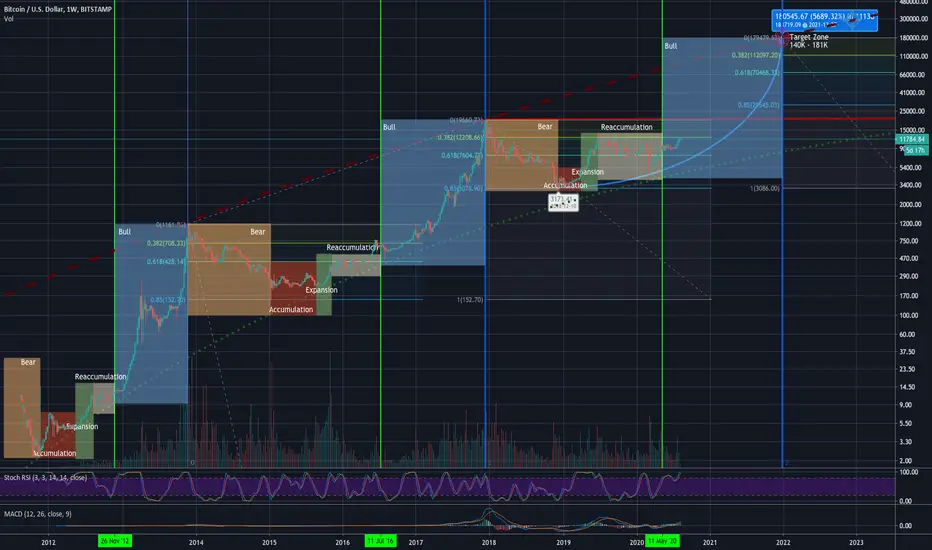
This idea is based on my idea of Bitcoin's future on a logarithmic scale from Jan 17, 2019.
Target is some corrected and I tried to show some zones depending on different market environments depending on peaks and events like halving. To define a target zone on a logarithmic scale is pretty meaningless and the fib retracments are a hint but cannot be crucial to define a peak End of 2021/Beginning 2022. This was guessing - looks nice but is still a prediction.
A better guess is to assume that the resistance curve is some more flat and could be hit at 140K
Please note that I deeply believe in this development but this is NOT A SUGGESTION to take a loan, debit your credit card to the edge, and buy Bitcoin like crazy. You rist your, your family's, company's and friends' wealth. Only risk what you can afford to lose.
Target is some corrected and I tried to show some zones depending on different market environments depending on peaks and events like halving. To define a target zone on a logarithmic scale is pretty meaningless and the fib retracments are a hint but cannot be crucial to define a peak End of 2021/Beginning 2022. This was guessing - looks nice but is still a prediction.
A better guess is to assume that the resistance curve is some more flat and could be hit at 140K
Please note that I deeply believe in this development but this is NOT A SUGGESTION to take a loan, debit your credit card to the edge, and buy Bitcoin like crazy. You rist your, your family's, company's and friends' wealth. Only risk what you can afford to lose.

免责声明
这些信息和出版物并非旨在提供,也不构成TradingView提供或认可的任何形式的财务、投资、交易或其他类型的建议或推荐。请阅读使用条款了解更多信息。