
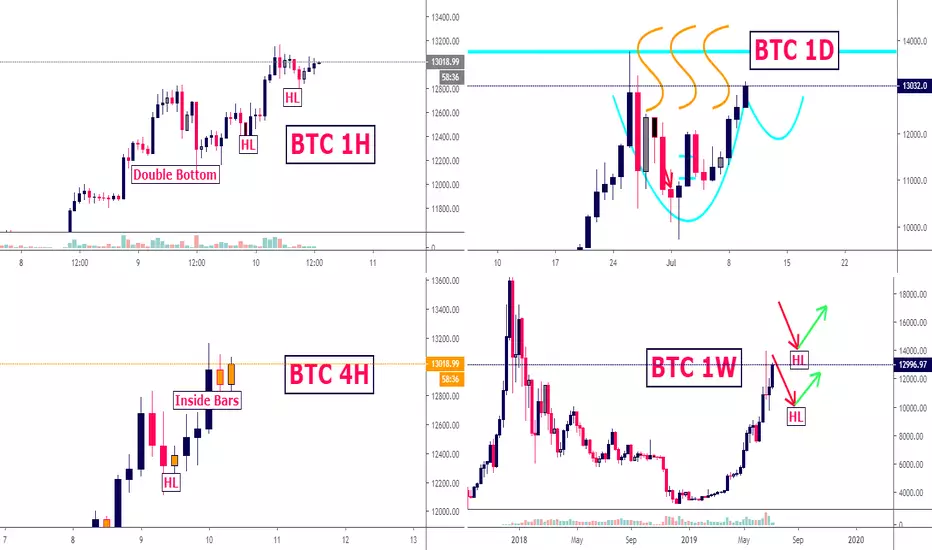
Hello dear crypto friends, in this special BTC analysis, we're gonna look at the different timeframes with grandpa BTC currently:
1H Chart

4H Chart

1D Chart

1W Chart

If you had some value from my analysis, give it a thumbs-up & comment it, because the mechanism shows my analysis to other people then. Make also sure to follow me so you get notified on my Crypto Analyses! I wish you a good trading! :)
Edgy is providing online mentorship & trading metrics only. We are not a financial advisor, nor do we hold any formal qualifications in this area. You're trading at your own risk. No matter what you do, please set your stop loss. Please be aware, that you can lose all your money on the online exchanges.
1H Chart
- Double Bottom defended the $12k.
- Since then Uptrend indicated by higher Lows
4H Chart
- Higher Lows successfully established at $12k
- Currently 2 Inside Bars which will indicate the direction when they break out
1D Chart
- Bullish Pennant Breakout
- Turns into potential Cup & Handle if we reject from $13k now, indicating further tightening
1W Chart
- Daily Bullish Pennant invisible, shows itself as Doji candle with huge upper wick
- Definitely overbought, and needs to consolidate soon, even if we now climb higher for a few days
If you had some value from my analysis, give it a thumbs-up & comment it, because the mechanism shows my analysis to other people then. Make also sure to follow me so you get notified on my Crypto Analyses! I wish you a good trading! :)
Edgy is providing online mentorship & trading metrics only. We are not a financial advisor, nor do we hold any formal qualifications in this area. You're trading at your own risk. No matter what you do, please set your stop loss. Please be aware, that you can lose all your money on the online exchanges.

免责声明
这些信息和出版物并非旨在提供,也不构成TradingView提供或认可的任何形式的财务、投资、交易或其他类型的建议或推荐。请阅读使用条款了解更多信息。